Transportation KPIs: which key indicators are relevant for your company?
Key performance indicators (KPIs) are a set of figures and statistics that you need to monitor in order to make the best decisions.
In a business like road haulage, where profitability is low, these figures are essential if you want to manage your business effectively and maintain your operating margins!
Table of contents
- Key figures for long-term growth and development
- How to make the most of key performance indicators
- The essential KPIs for better logistics management
- The useful KPIs for monitoring driver performance
- Key figures for measuring service quality
- Other useful performance indicators
Monitoring transportation KPIs is essential in the logistics industry. For company managers, analysing these key performance indicators is the guarantee of improving their margins and identifying opportunities.
Key figures for long-term growth and development
According to the results of a study carried out by Banque de France and FNTR (National Federation of Road Transport) in 2022, more than half of road haulage companies are less than 8 years old, and their current pre-tax profit is just 2%.
In other words, companies in this sector are both younger and more insecure than those in the rest of the economy.
To maintain and improve their operating results year after year, transport company CEOs and managers have no choice. They have to check their key indicators very regularly, and do what’s necessary to improve or optimise them!
![]()
How to make the most of key performance indicators
The key figures are provided by your transport software (TMS), or more generally by supply chain management software.
You can also use certain statistics provided by your CRM, accounting and human resources tools.
Although all these software packages are now able to provide very comprehensive KPIs and dashboards… they’re not inventing anything! To get reliable results, you need to take the time to fill in all the relevant data for your business accurately, and don’t settle for approximations.
The essential data processed by all transport software includes:
- Details of vehicles (registration number, engine, load capacity, etc.).
- Identification of drivers.
- Customer and warehouse addresses.
- Characteristics of goods shipped (weight, volume, value, number of packages, type of delivery, etc.).
However, there’s no point in accumulating figures and multiplying tables, as this can waste a lot of time. To monitor and improve your company’s productivity, it’s best to select a few priority indicators for your business, and track them very closely!

The priority indicators in your transport business need to be tracked carefully.
The essential KPIs for better logistics management
These key performance indicators are essential for monitoring and improving the efficiency of logistics processes, and therefore the company’s profitability.
Most software packages provide analysis by day, week or month. It’s up to you to decide which period is most relevant to your business.
Distances travelled
In this case, it is above all the difference between planned distances and actual distances that will enable you to detect any problems in the logistics organisation, either within your company or at the end customer’s premises.
- Total distances travelled.
- Average distance per route.
- Average distance per delivery.
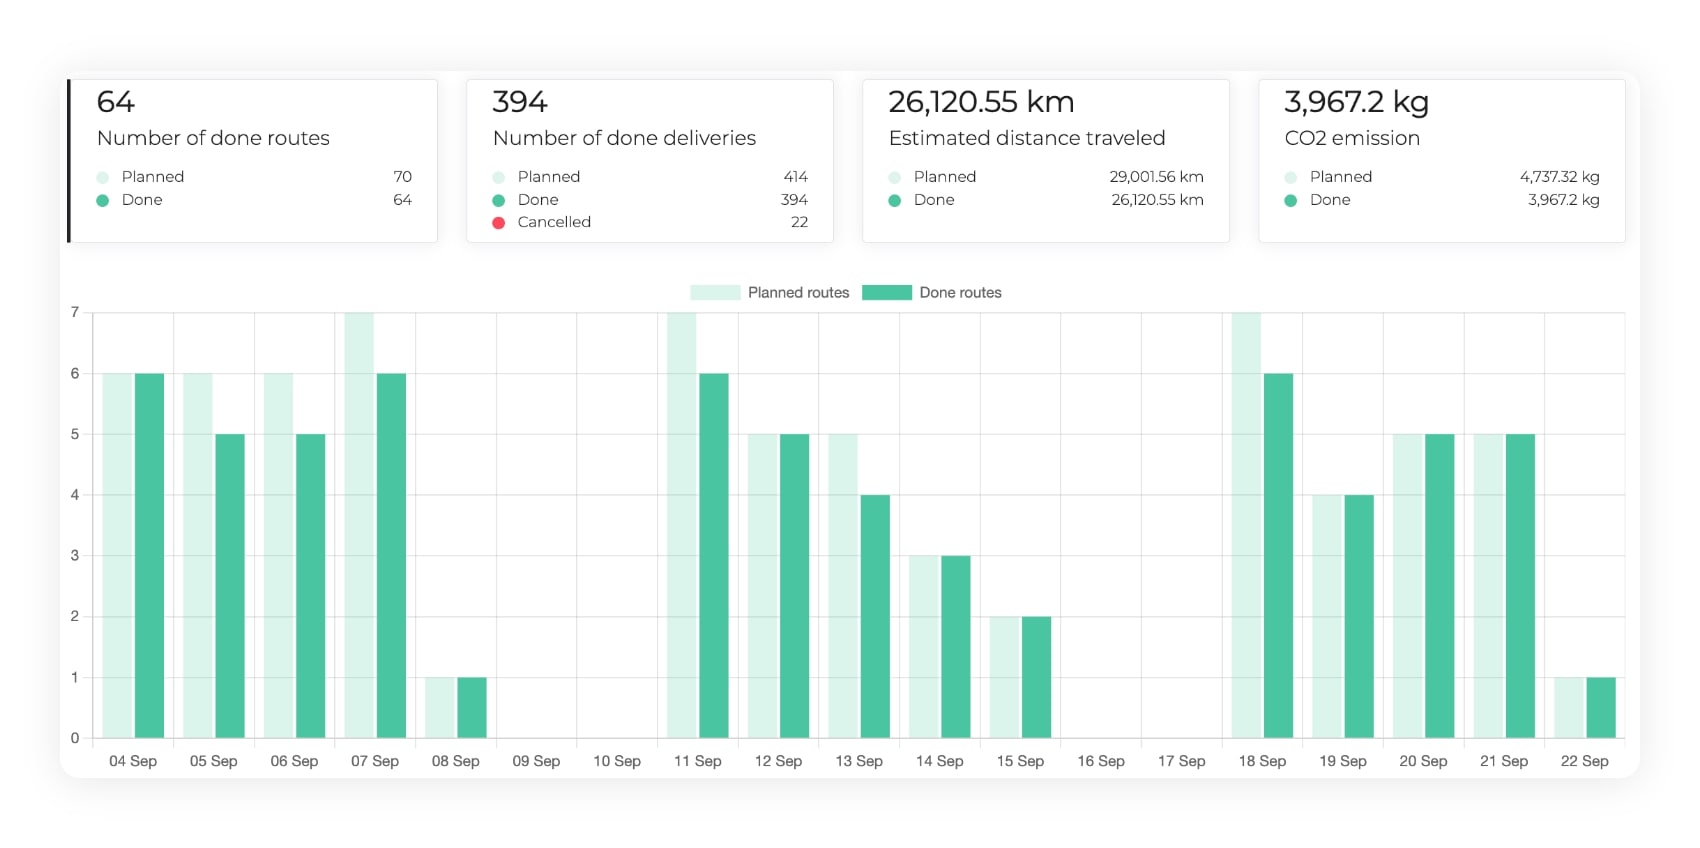
The analysis of distances travelled on AntsRoute.
Business volume
By monitoring these indicators, you can quickly identify any abnormal variations in activity, and reorganise your teams to restore optimum productivity.
- Number of transport orders.
- Number of planned and completed deliveries.
- Total quantity of goods transported.
- Value of products transported.
Use of the fleet
In an inflationary environment, hauliers are looking for the slightest unnecessary expense to maintain and improve their margins. Fortunately, transport software, and delivery management software in particular, provide you with invaluable indicators for smartly optimising the vehicles available.
- Filling rate per truck.
- Quantity of goods per delivery or per kilometre.
- Level of service for each vehicle (weight or volume of goods transported, distances travelled, etc.).
- Distance travelled empty.
- Fleet downtime for maintenance and repairs, etc.
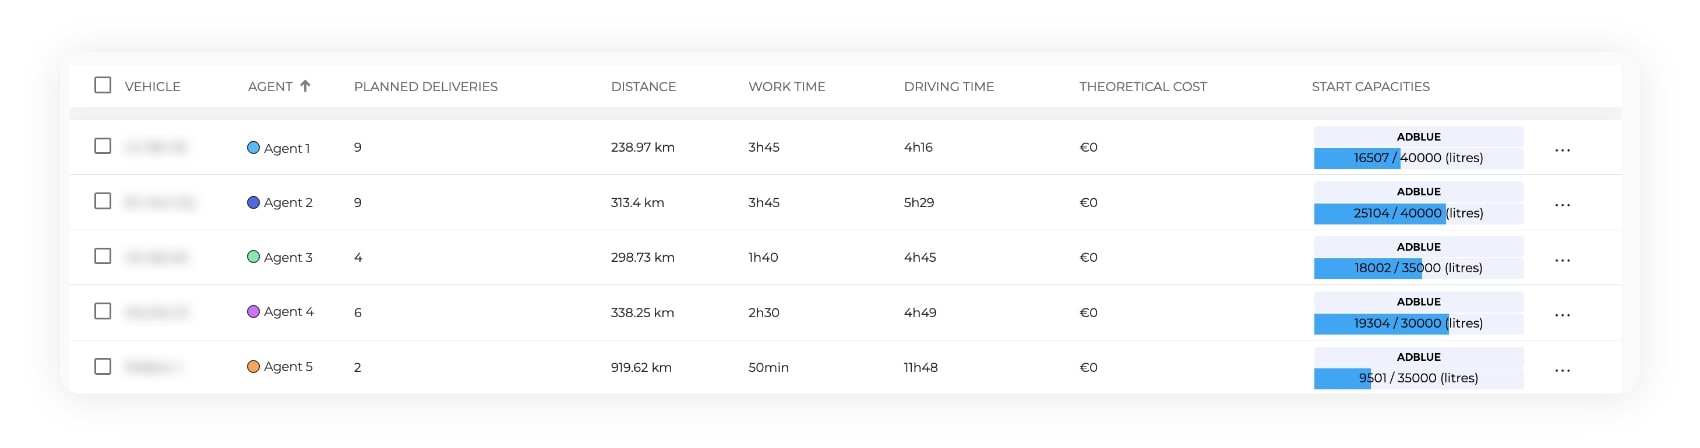
The analysis of truck loading rates on AntsRoute.
In addition to these indicators, some software packages such as AntsRoute also provide a heat map of delivery, which is very useful for boosting your sales efforts in certain areas, or conversely, outsourcing journeys in others.
Financial indicators
For hauliers, margins are the sinews of war, as the representative of the Banque de France reminded us at the last congress of the Fédération nationale des transports routiers (FNTR: National Federation of Road Transport).
Yet the gross operating margin (EBITDA) is only 6.4% on average, even though fuel alone accounts for 10% of sales!
If they want to remain both profitable and competitive, managers need to keep a close eye on the various cost items, and pass on any increases in transport prices as soon as possible.
- Fuel consumption per route, per kilometre, per truck, etc.
- Cost of maintenance and repairs.
- Average cost per route, per delivery, per truck, etc.
- Total cost of logistics operations for the company.
- Total cost of ownership for each vehicle.
- Total cost of fleet ownership.
- Gross margin per operation.
- Gross margin for all transport operations, etc.
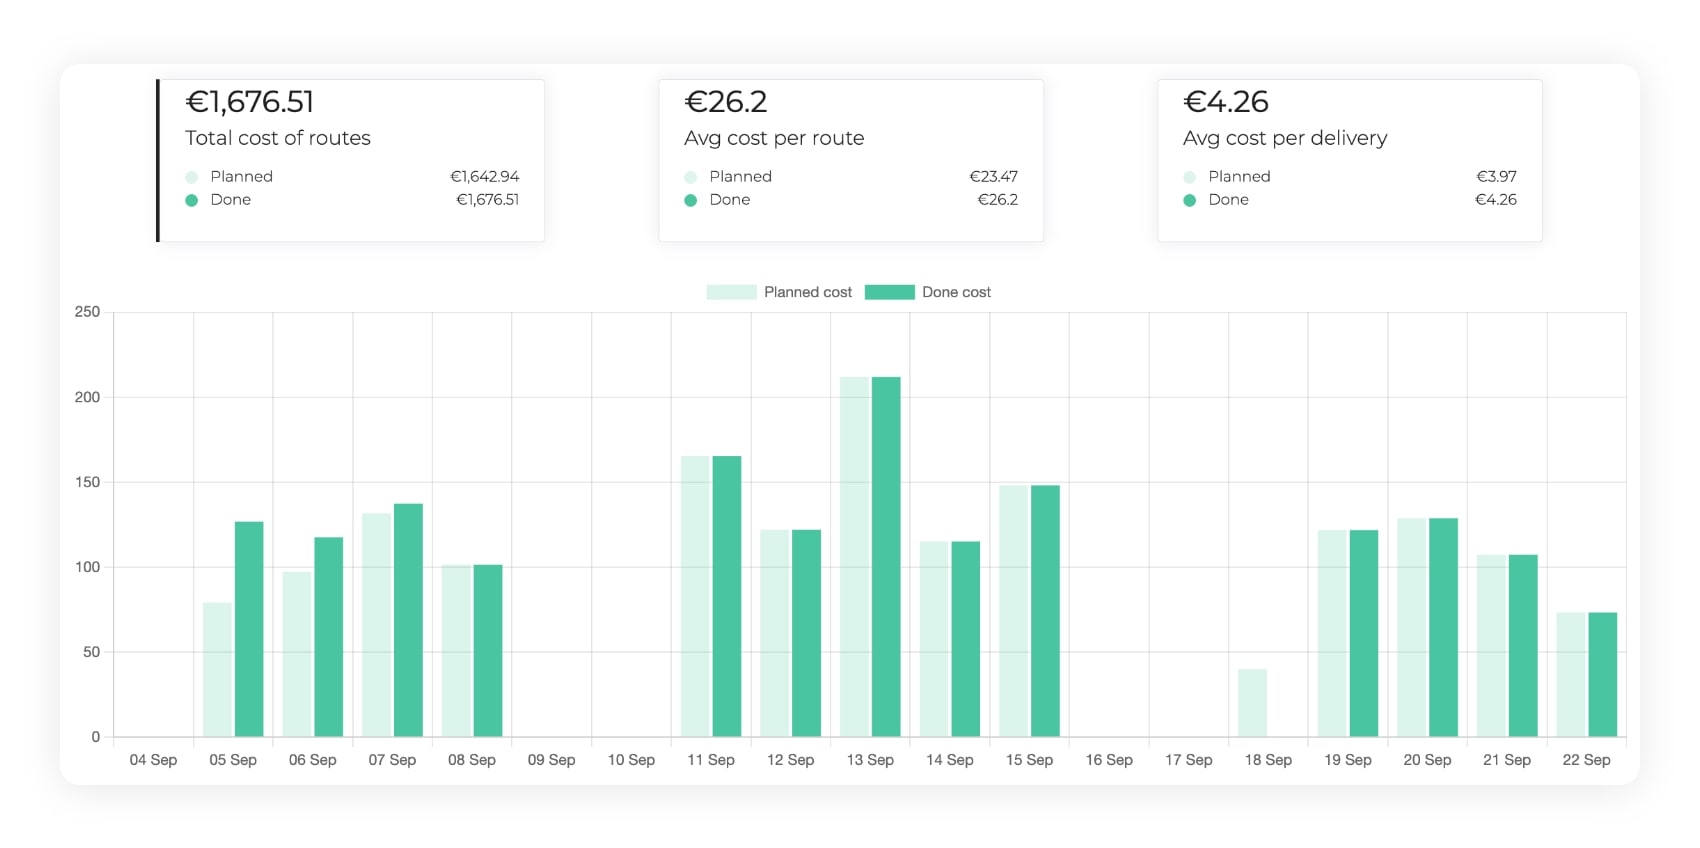
The analysis of transport route costs on AntsRoute.
The useful KPIs for monitoring driver performance
Staff costs (wages + charges) account for about three quarters of added value, i.e. the cash flow generated by the company’s operations. It is difficult to reduce these costs at a time when most hauliers are struggling to attract new drivers and retain existing ones.
In this context of shortage, the most realistic solution is once again to optimise driver activity using your transport software.
Human resources management
- Number of drivers actually available.
- Reason for absences (holiday, sick leave, training, etc.).
- Occupancy rate of each driver.
- Level of service per driver (number of deliveries made or kilometres actually driven).
- Number of operations per hour, etc.
Quality of the work carried out
- Average duration of operations per driver (loading, unloading, delivery, etc.).
- Driving time compared with total working time.
- Time spent at the customer’s premises compared with total working time.
- Average fuel consumption for each driver (eco-driving).
- Rate of disputes per driver, etc.
In addition, most transport software now offers real-time driver tracking. This feature may not be a performance indicator in the strict sense of the term, but it is nonetheless essential for optimising the efficiency of teams in the field and detecting any inappropriate behaviour at an early stage.
![]()
Key figures for measuring service quality
The quality of service has a considerable impact on customer loyalty, but also on the corporate image. However, many transport companies see their online reputation impacted by a large number of negative reviews…
Rigorous monitoring of customer satisfaction indicators is essential for analysing the causes of problems and implementing corrective action.
Are these difficulties due to insufficient communication? Is the planning too ambitious? Are customer complaints correctly assigned or concerned only a few drivers? These are just some of the questions to ask in the light of these indicators.
Monitoring customer satisfaction
- Number of satisfaction questionnaires or customer reviews.
- Average rating.
- Total dispute rate.
Reliability of planning
- On-time service rate (operations fully processed within the announced timeframe).
- Early or delayed delivery of orders.
- Cancellation rate.
- Reason for cancellations, possibly by type or origin: scheduling error, contact details, unforeseen customer absence, etc.
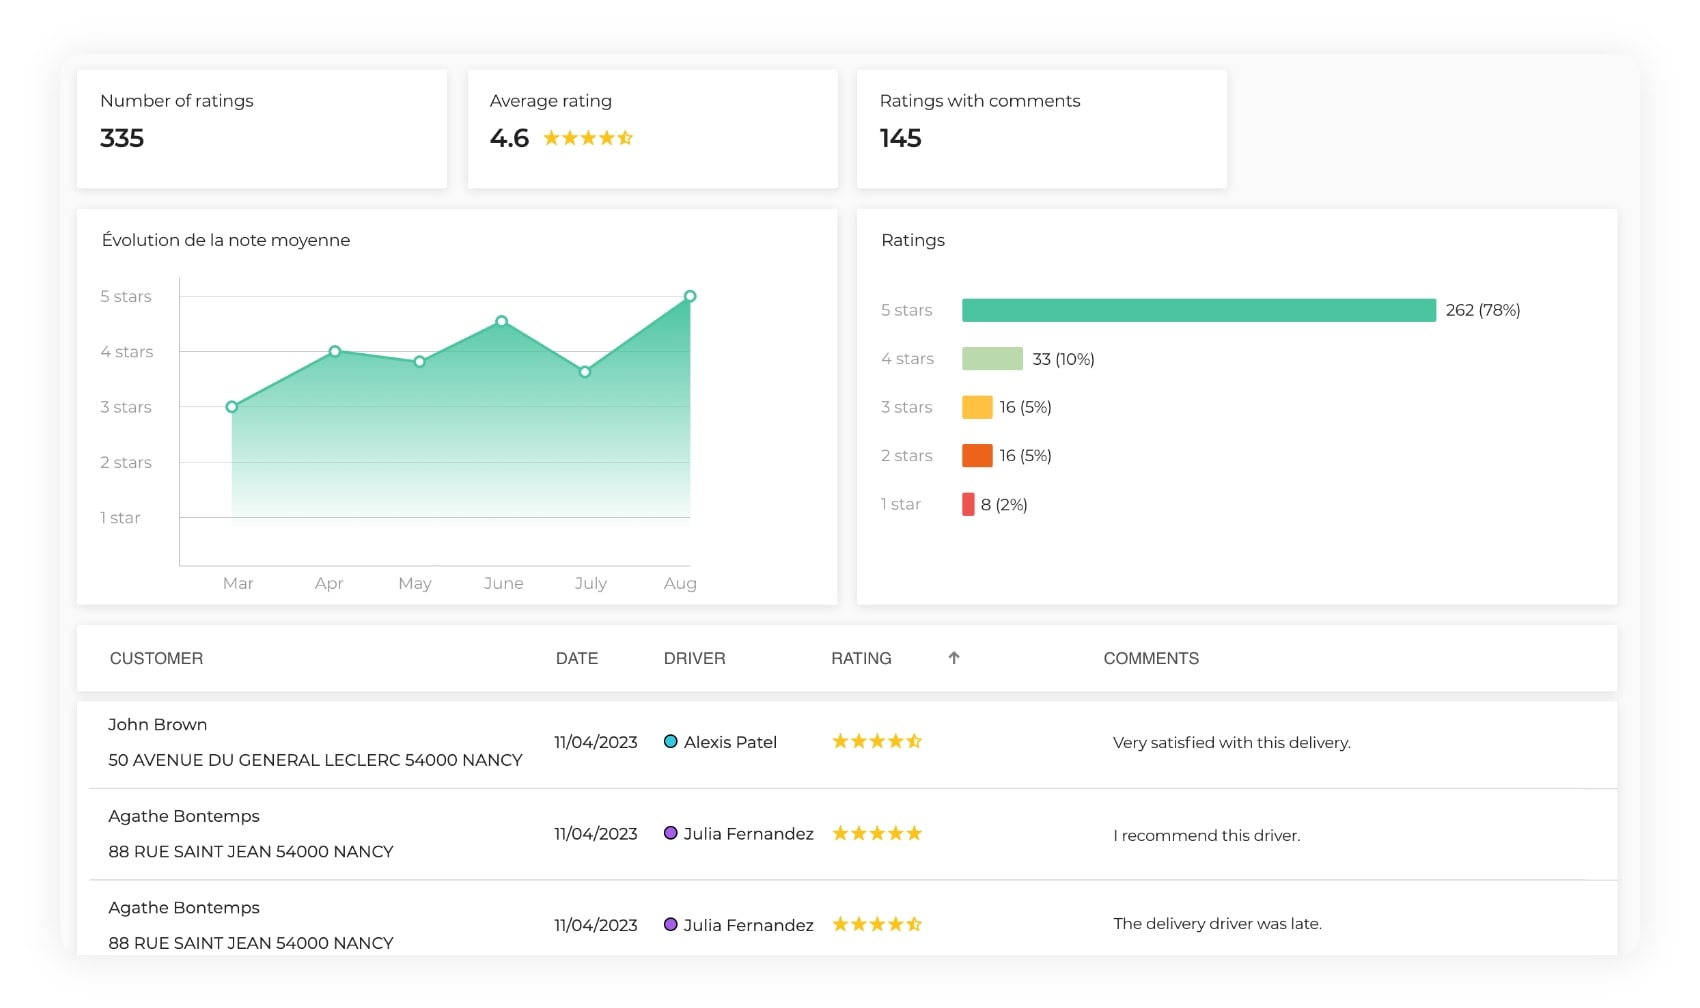
The analysis of delivery quality ratings on AntsRoute.
Other useful performance indicators
Faced with pressure from consumers who are asking them to save the planet while delivering their orders as quickly as possible, more and more companies are thinking about more sustainable logistics solutions.
These indicators will therefore be useful for measuring the improvements you have made, as well as for drawing up your carbon footprint if your company is concerned:
- Total CO2 emissions.
- Average CO2 emissions per route or per vehicle.
- Rate of kilometres travelled empty.
- Percentage of environmentally-friendly vehicles in the fleet.
- Percentage of orders delivered with an environmentally-friendly vehicle, etc.
Logistics KPIs (excluding transport)
Depending on your activity and your position in the supply chain, you may need to monitor other key indicators to improve your own performance, or that of your partners and subcontractors.
Here are the main KPIs that can be used to identify shortcomings in supply chain and warehouse management:
- Rate of replenishment orders delivered late.
- Rate of disputes concerning restocking operations (incorrect delivery, damaged packaging, broken products, etc.).
- Total number of items in stock.
- Number of days and products out of stock.
- Number of sales cancelled due to unannounced stock-outs.
- Stock turnover ratio.
- Cost of warehousing compared to sales, etc.
With over 25 KPIs processed, our delivery software offers you clear and comprehensive dashboards to manage all your transport operations efficiently.
Do you also run an e-shop or warehouse? Easily connect AntsRoute to your favourite tools such as WooCommerce, PrestaShop, Odoo and many others, to monitor your supply chain in real time!
To try AntsRoute for free and with no obligation for 7 days, sign up here.
Free 7-day trial | No credit card required
Contenu
- Key figures for long-term growth and development
- How to make the most of key performance indicators
- The essential KPIs for better logistics management
- Distances travelled
- Business volume
- Use of the fleet
- Financial indicators
- The useful KPIs for monitoring driver performance
- Human resources management
- Quality of the work carried out
- Key figures for measuring service quality
- Monitoring customer satisfaction
- Reliability of planning
- Other useful performance indicators
- KPIs relating to social and environmental responsibility
- Logistics KPIs (excluding transport)