Driver Retention: The Guide to Finally Keeping Your Delivery Drivers Motivated in 2026
They know every street, every customer, every traffic jam… and yet, drivers are leaving ship in droves. Between record turnover, stress on the road, and endless days, keeping teams loyal has become a real challenge for transport and delivery companies.
Salary matters, of course, but it’s not enough. What drivers are looking for today is, above all, stability, recognition, and humane schedules. A simple trio: predictability, fairness, and respect.
The good news? Thanks to smart planning tools, it’s now possible to take concrete action on these levers. So, how can you reduce turnover and keep your drivers truly motivated over the long term?
Table of contents:
- Why are Drivers Leaving?
- The 6 Golden Rules for a Sustainable Delivery Route
- Integrate and Retain from Day One: Step-by-Step Onboarding
- Pay and Employment Status: Why Predictability Keeps Delivery Drivers Longer
- Measure Retention Like a Logistics KPI
Why are Drivers Leaving?
The transport sector has one of the highest turnover rates in Europe. The reasons are many, but most of them can be fixed – provided we rethink day-to-day planning and management.
Never-ending days and sacrificed breaks
For many drivers, delivery routes feel like a race against the clock. Tight targets, unrealistic routes, underestimated parking times… The result: breaks are often pushed back, or even forgotten altogether, and fatigue builds up.
“When they ask you to chain 80 stops in the city center without a break, you last two weeks, no more,” says Aurélien, a delivery driver in Marseille, France.
The issue doesn’t only come from the pace, but from planning that sometimes forgets the human factor. Including breaks and rest periods isn’t optional: it’s a legal requirement and a safety imperative.
Unpredictability: the real poison for retention
A driver who never knows what time they’ll finish or which area they’ll be delivering in the next day eventually loses heart. Unstable schedules, especially when zones change every day, are one of the main reasons people leave.
“In the evening when I get home, I never know if I’ll be able to have dinner with my kids. That’s what wears you down,” says Ulysse, a driver for seven years in the Lyon area, France.
A driver is naturally more efficient in a familiar area: they find access points faster, know the building codes, and optimize their routes. It means less stress. The solution? Stable delivery zones and predictable working hours.
Ignored weak signals: an underused goldmine of information
Drivers are the eyes and ears of the company. Before resigning, many leave clues: repeated incidents, unread delivery notes, recurring delays, or difficult customers. But in organisations where communication is fragmented, these weak signals often go unnoticed. And the same pattern repeats itself: loss of engagement, sloppy proof-of-delivery, and eventually, resignation.
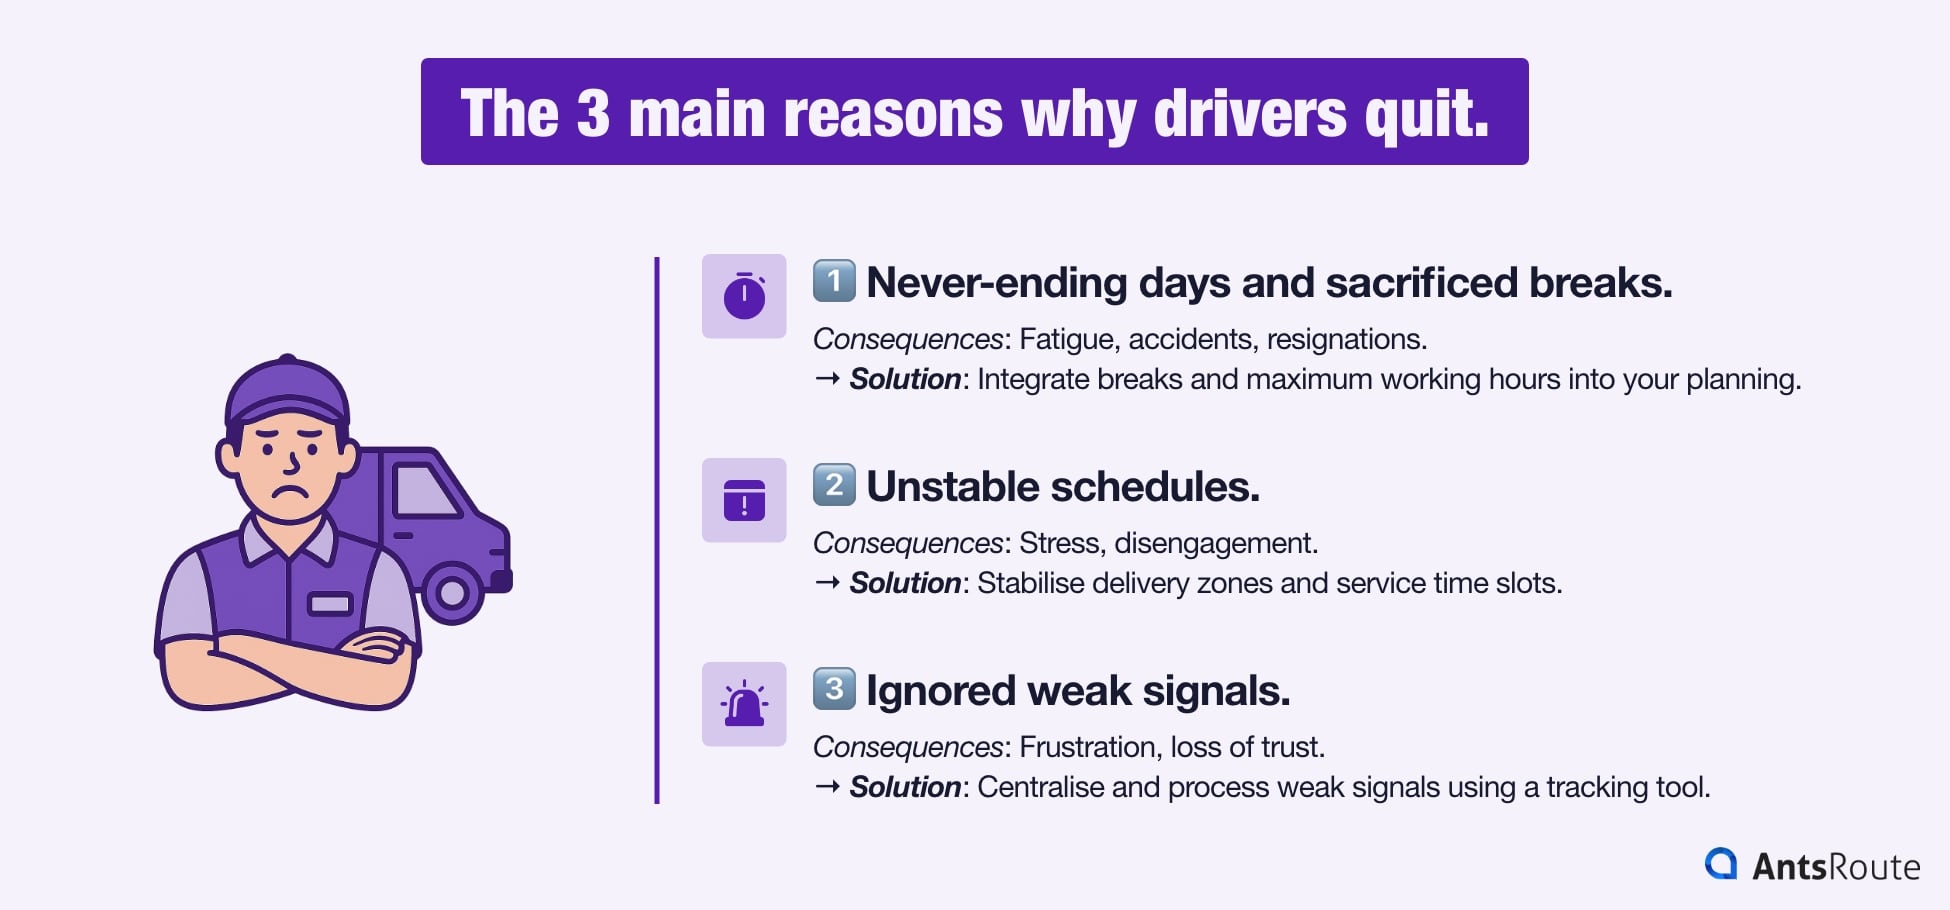
The 3 main reasons why drivers quit.
But don’t worry, there are solutions! AntsRoute, for example, centralizes all your field data in a single dashboard. This allows managers to detect tensions, act quickly, and prevent people from leaving.
In summary: the prevention levers to activate right now
| Problem | Consequence | Solution |
| Unrealistic routes | Fatigue, accidents, resignations | Include breaks and working time limits in planning |
| Unpredictable schedules | Stress, disengagement | Stabilize delivery zones and service time slots |
| Lack of feedback from the field | Frustration, loss of trust | Centralize and process weak signals with a tracking tool |
The 6 Golden Rules for a Sustainable Delivery Route
Retention doesn’t start with a bonus or a training session, but right from the moment the route is created.
Here are the 6 golden rules to make it happen.
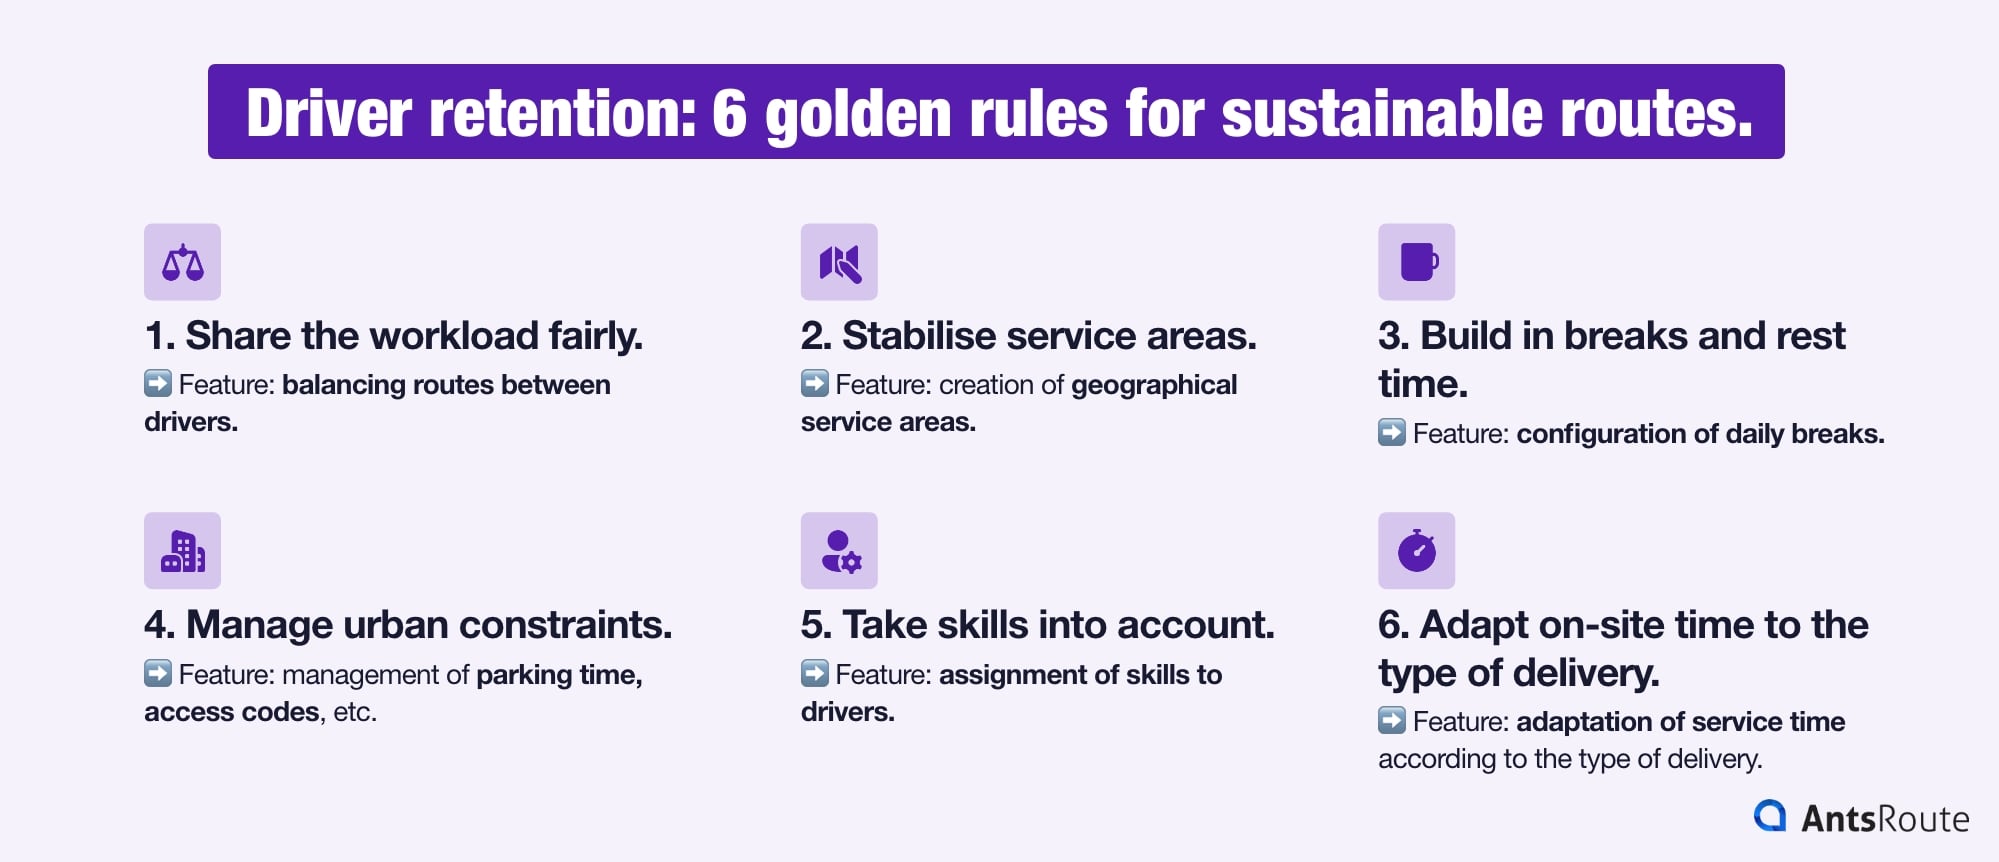
Driver retention: 6 golden rules for sustainable routes.
It’s one of drivers’ most common complaints: “Why does he have 10 stops less than me?” When the workload is seen as unfair, motivation collapses. In practice, though, balancing routes isn’t just about the number of stops. You have to take into account distance, weight, service time, number of floors, and urban density. A stop in the city centre, with stairs and heavy loads, is not equivalent to a stop in a suburban area.
“Before, we always had one driver who finished two hours after the others. Since we started using AntsRoute, everyone gets back at roughly the same time,” says Vincent, logistics manager at a food distribution SME.
☝️ AntsRoute automatically assigns a weight or duration to each job to balance routes between drivers.
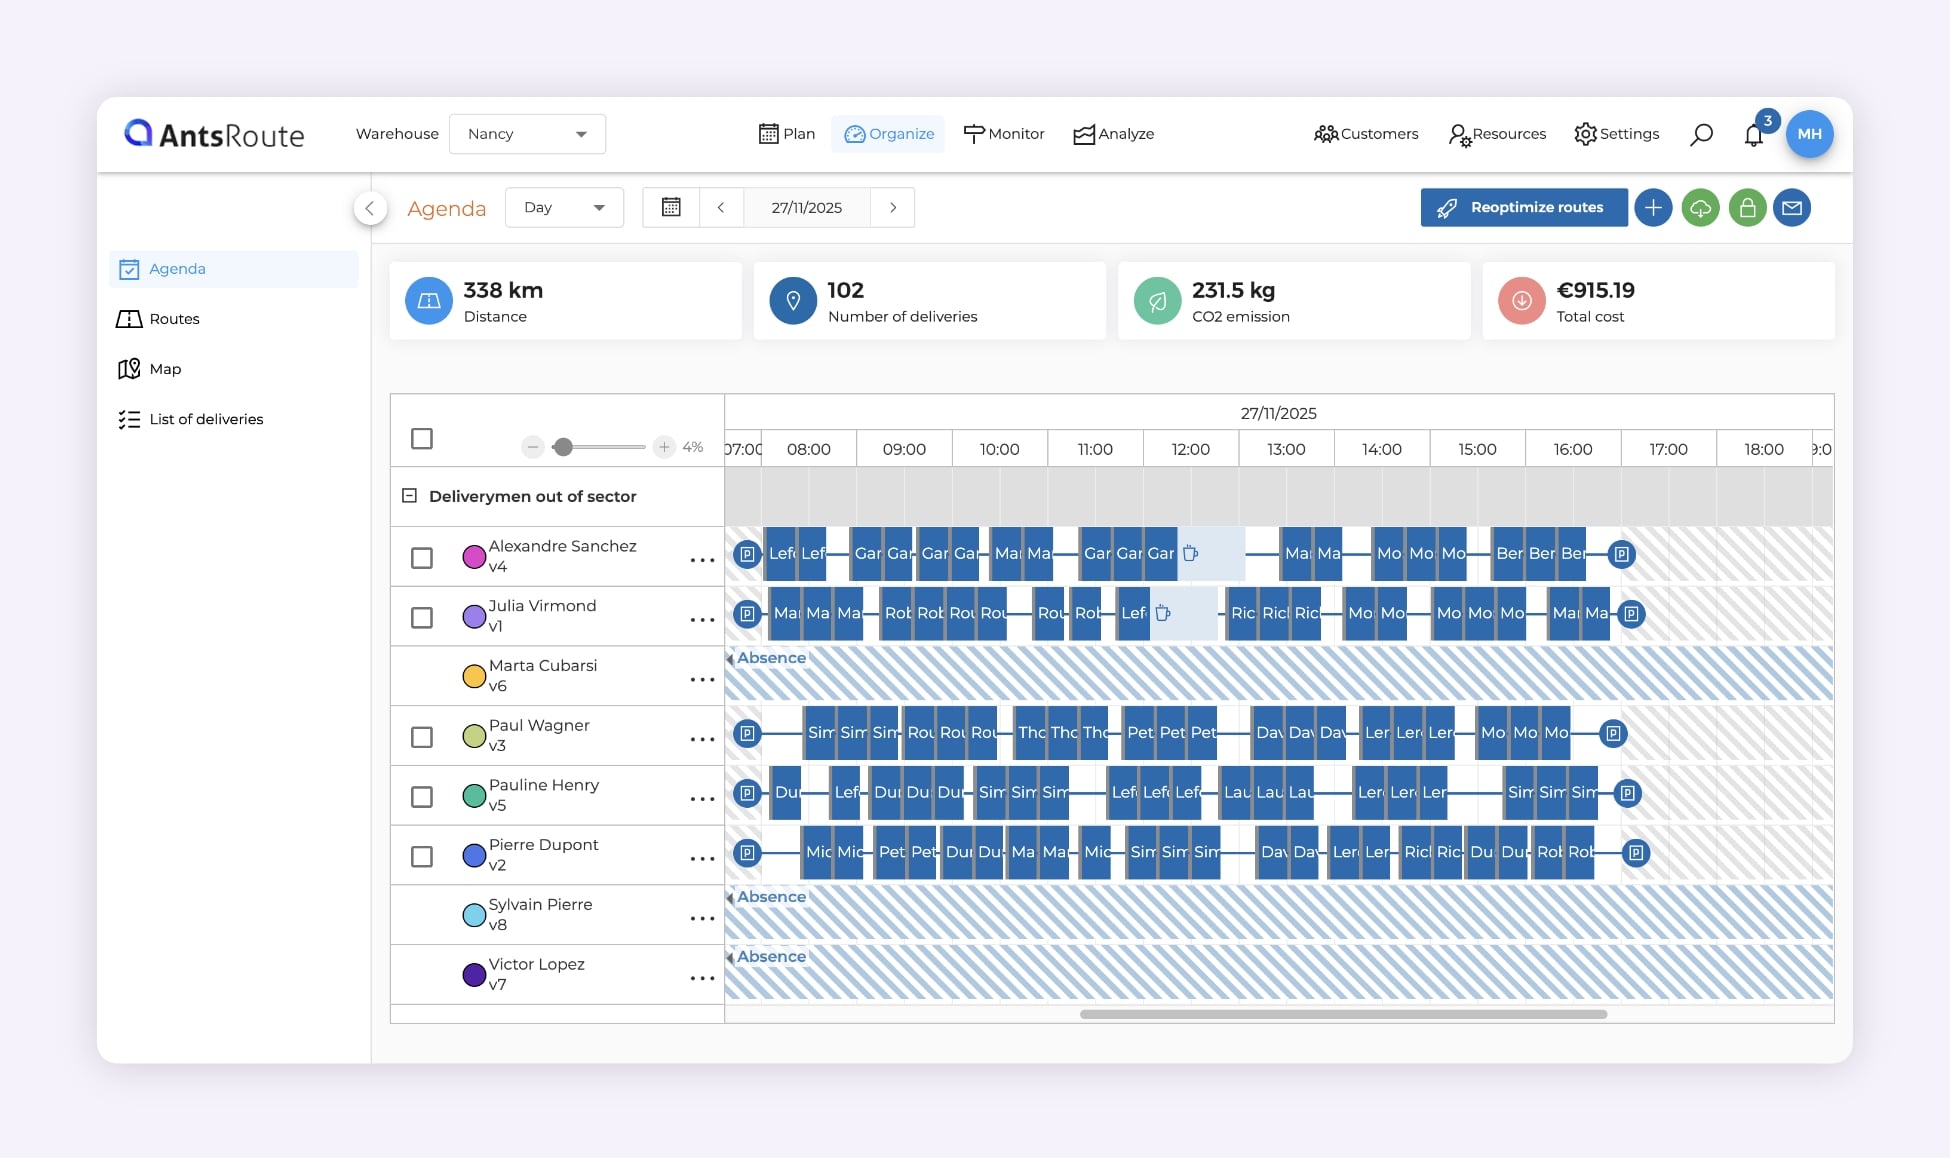
Building balanced delivery routes with AntsRoute.
2. Stabilise service areas
Changing area every week is like starting from scratch: new addresses, new access points, new customers. In the long run, this instability creates stress and a loss of bearings. By assigning a driver to a specific sector, you not only increase peace of mind, but also efficiency: they know their customers better, anticipate tricky access, and waste less time looking for addresses.
“Since we’ve had fixed zones, our drivers are faster and our first-attempt delivery rate has gone up by 8%. It’s a virtuous circle,” explains Aïcha, logistics manager in Lille, France.
☝️ AntsRoute lets you set fixed or flexible service geographical zones. One-off exceptions (covering for someone, emergencies) can be managed without throwing everything else off balance.
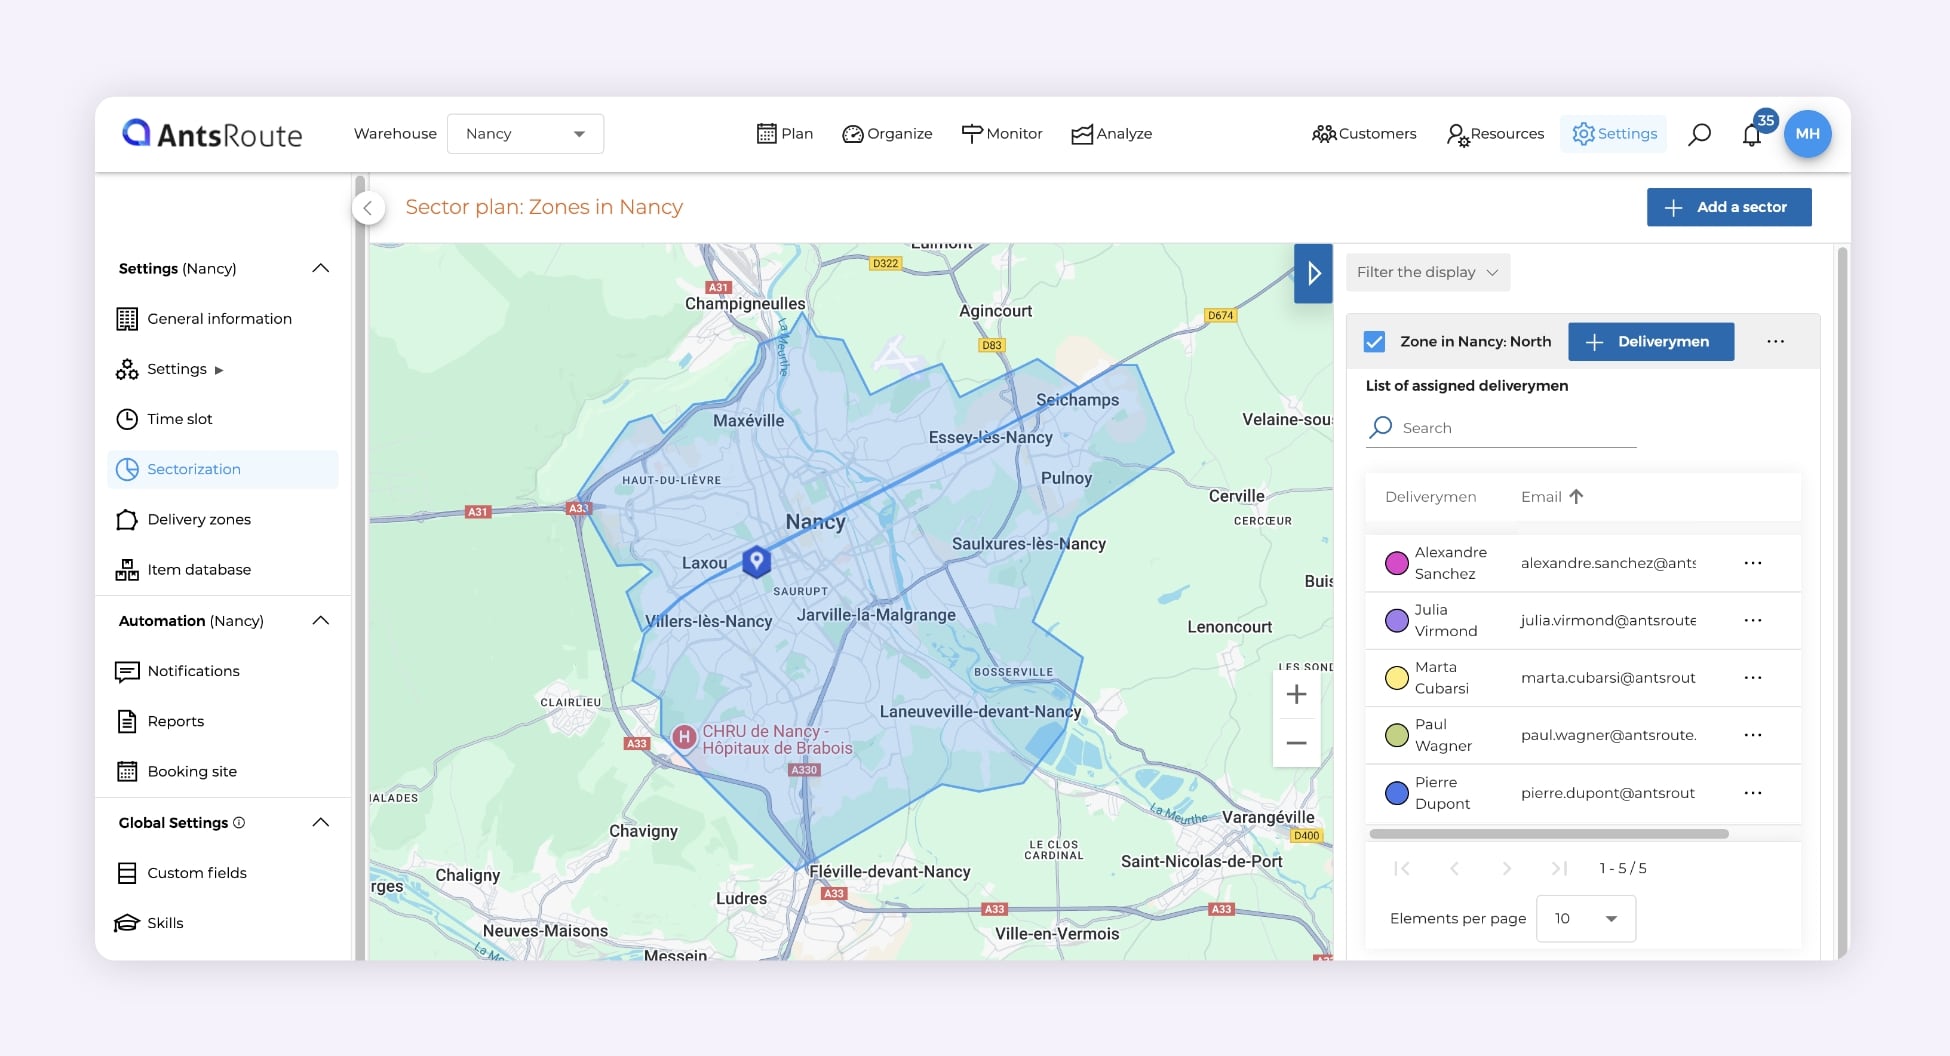
Assigning drivers to geographic zones in AntsRoute.
3. Build in breaks and rest time
A break isn’t wasted time: it’s a legal requirement and a key safety factor. Standard planning software often forgets this, forcing drivers into impossible routes. As a result, drivers “skip” their break to meet deadlines.
☝️ AntsRoute lets you configure breaks (micro-breaks, lunch break, etc.) according to precise rules and track whether they’re taken in real time. It’s simple, transparent, and compliant with legal requirements. And thanks to the ETA (Estimated Time of Arrival) calculated by the algorithm, the promise made to the driver about their finishing time becomes as reliable as the one made to the customer.
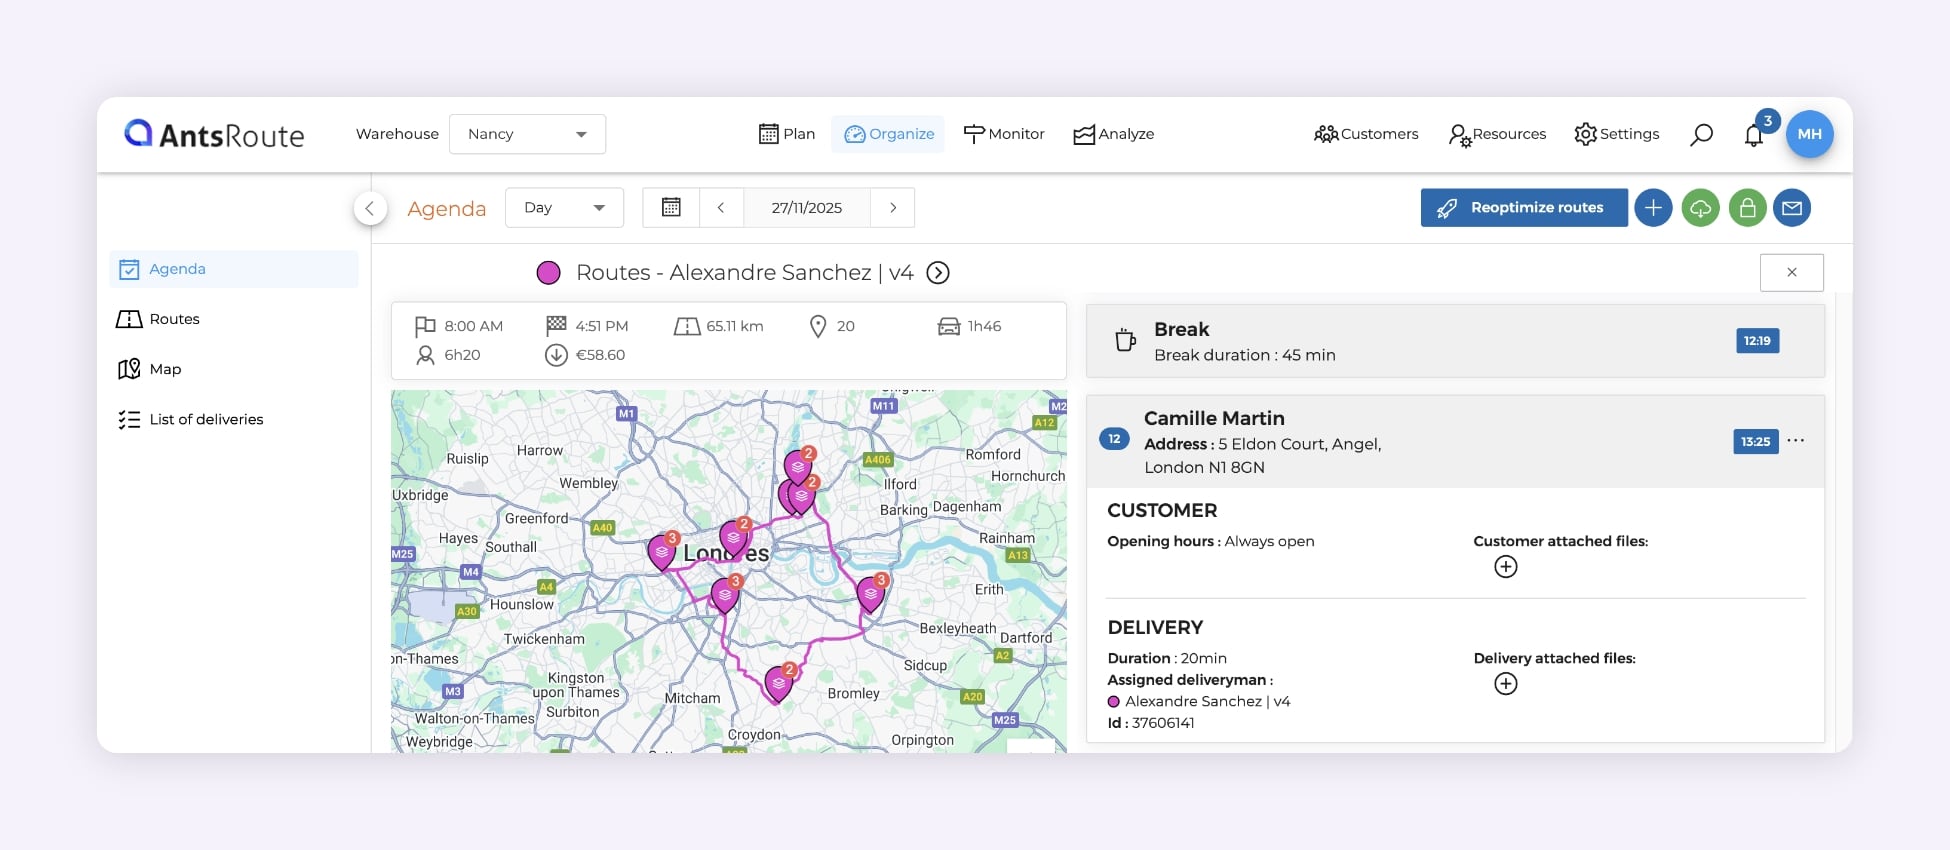
The integration of breaks when optimising a route in AntsRoute.
4. Manage urban constraints: parking, access, safety
Finding a parking space or getting into a secure building can turn a smooth route into an obstacle course. These details, often underestimated, weigh heavily on drivers’ mental load.
☝️ AntsRoute integrates these parameters into planning: average parking time by area, access codes, badges, photos, and geofencing for sensitive zones.
5. Take skills and certifications into account
Not all deliveries are the same: some require specific skills such as handling, ADR training, a forklift licence, taking measurements, and so on.
☝️ AntsRoute assigns skill tags to drivers and automatically filters jobs according to their qualifications. Each driver receives tasks suited to their profile, with no unpleasant surprises.
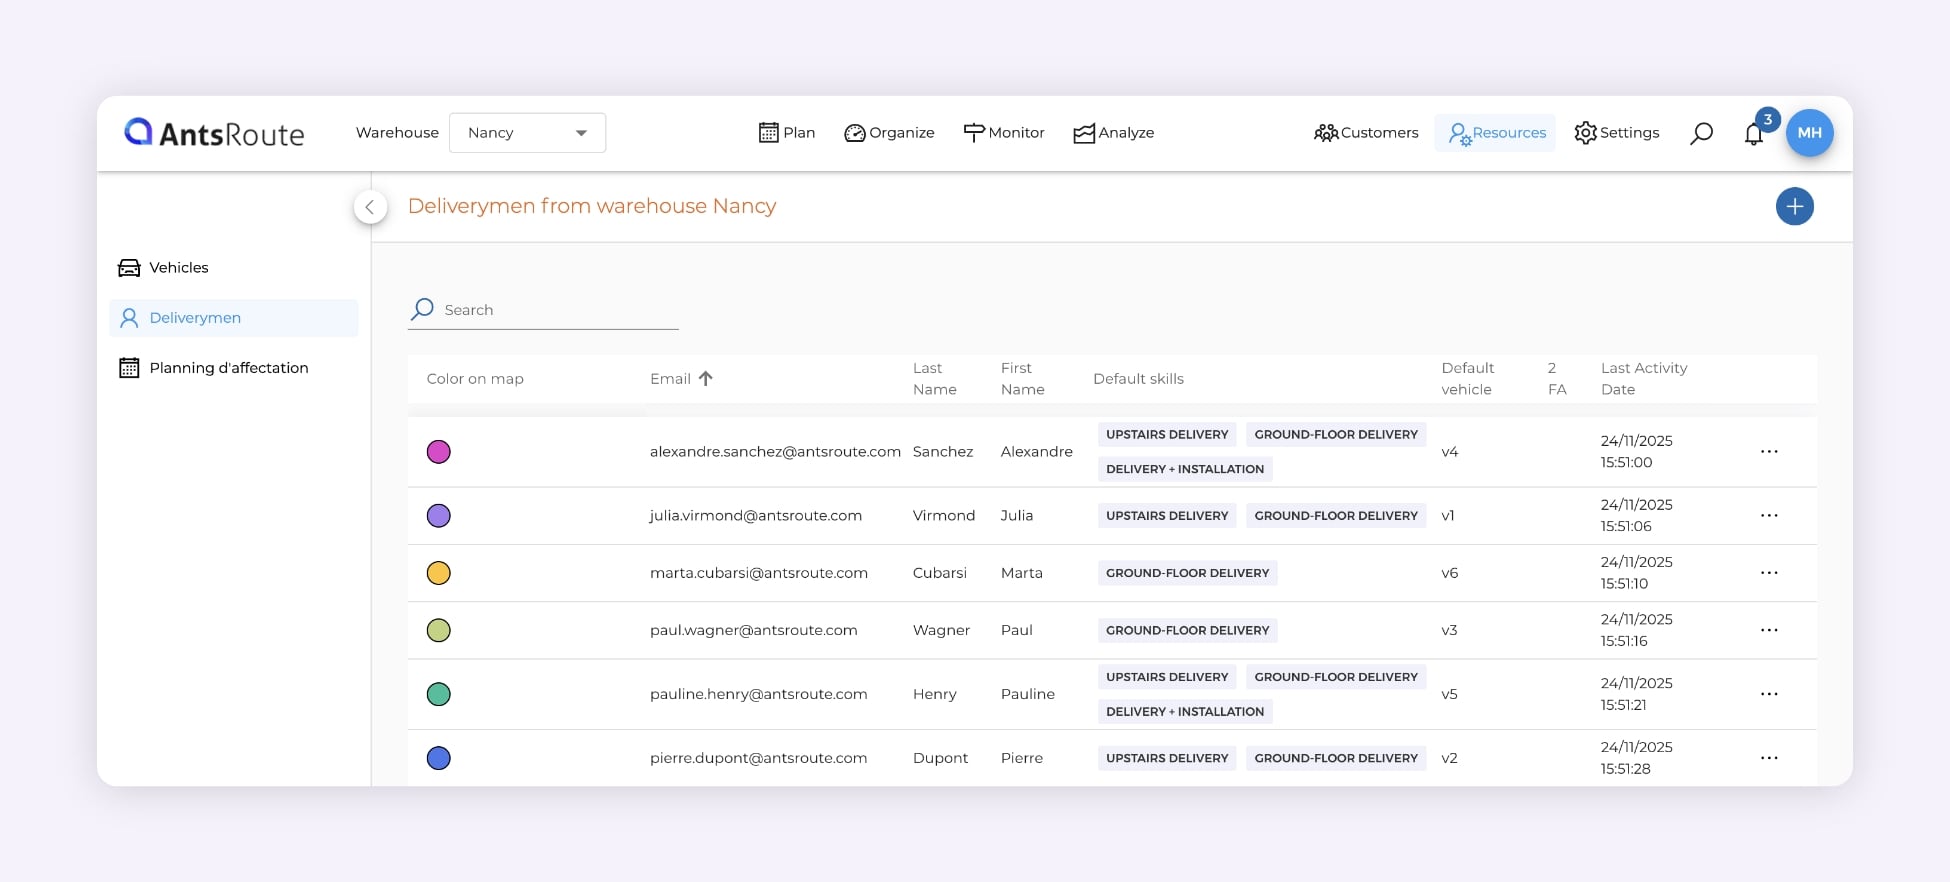
Assigning skills to delivery drivers in AntsRoute.
6. Adapt on-site time to the type of delivery
A stop at a B2B warehouse has nothing in common with a home delivery. And yet, many schedules apply a standard duration per stop, which completely distorts the actual route times. The result: unnecessary pressure on drivers and a chain reaction of delays.
☝️ AntsRoute models service time (“dwell time”) based on the type of delivery (B2B, home, peri-urban, etc.) or even the season, for more realistic planning.
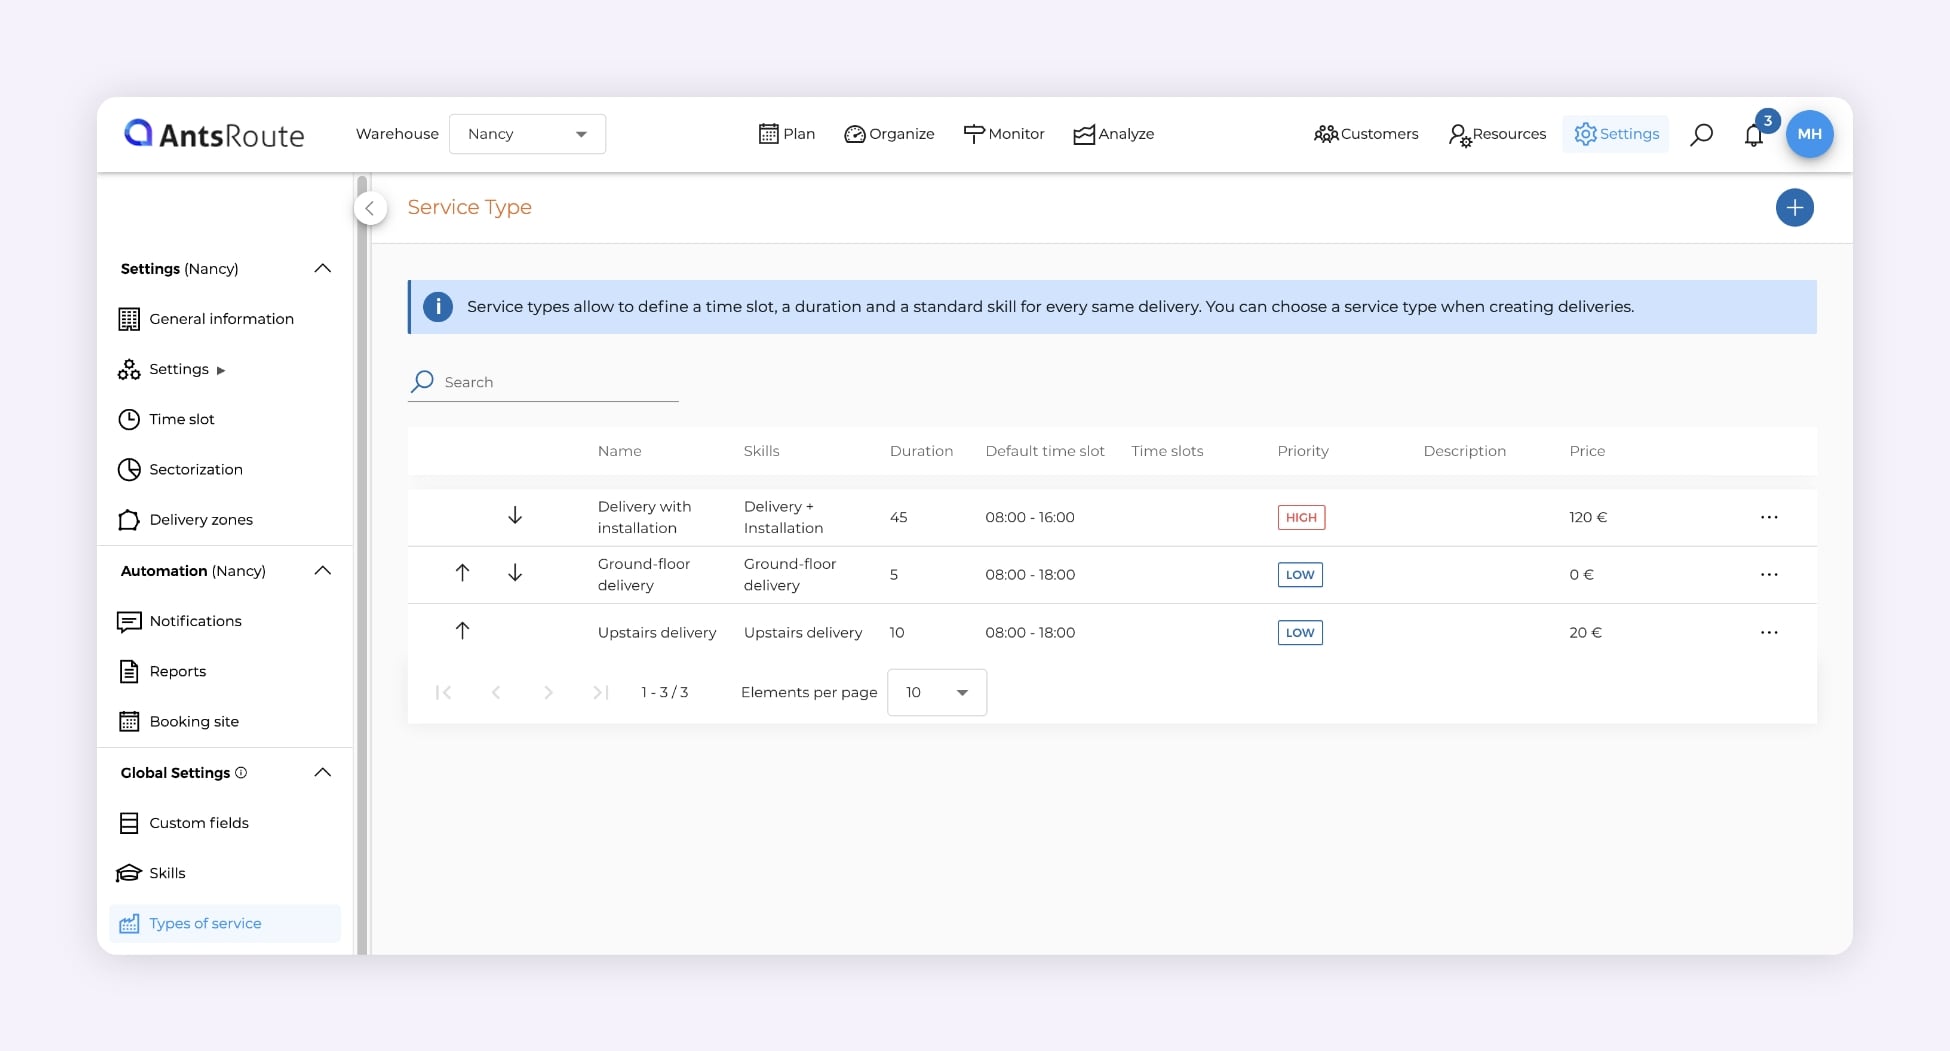
Creating delivery types in AntsRoute.
Integrate and Retain from Day One: Step-by-Step Onboarding
In a sector where turnover sometimes exceeds 30%, retention starts well before the first official route. A driver who is well trained, well supported, and well equipped from the start is often a driver who stays. The goal: turn the first 90 days into a structured, reassuring, and motivating experience.
Day 0: the safe start
Day one should never feel like a leap into the unknown. The goal is to reassure, equip, and connect. As soon as they arrive, the new driver discovers their environment: they’re given PPE, the route smartphone, charger, in-vehicle holder, and access badge. Then it’s time for a short training session: a few video capsules of around ten minutes each covering the essentials of the job (safety, ergonomics, how to use the driver app, managing proof of delivery, customer communication tone, and GDPR).
☝️ With AntsRoute, the new driver completes a three-stop mock route to familiarise themselves with the workflow, notifications, and POD validation.
“The test route is a real trigger. New recruits immediately understand how the app works and, above all, that we’re not just throwing them in at the deep end,” explains Sophie, logistics manager in a transport company.
At the end of this first half-day, the driver completes their training quiz, signs the operations charter, and checks their equipment.
Weeks 1 to 2: intensive buddying
The first two weeks are decisive. This is the buddying period, when every new hire is paired with an experienced mentor.
Goal: zero incidents, zero stress, zero solitude.
For the first three days, the mentor drives and explains. Over the following days, the roles are reversed: the new hire takes the wheel while the mentor observes and corrects. At the end of each day, a quick debrief covers the key points: safety, taking breaks, managing PODs, customer feedback, incidents encountered, and so on.
☝️ AntsRoute helps supervisors track these indicators on a daily basis: average waiting time, ETA drift, and compliance with breaks.
At the depot, a “golden rules totem” reminds everyone of the key reflexes:
- Maximum waiting time at each stop,
- Secure refusal protocol,
- Systematic photo in case of absence,
- Call the customer before going to a risky address.
These simple actions quickly become second nature.
Weeks 3 to 12: supported autonomy
Once the basics are mastered, the driver becomes autonomous but remains supported through regular monitoring and well-established routines.
Each week, a 15-minute check-in with the operations manager compares planned workload vs. actual workload, reviews incidents, and gathers field feedback. Micro-training sessions round out this follow-up:
- Week 3: advanced navigation and smart re-optimisation of routes;
- Week 4: handling disputes and proof of delivery;
- Week 5: safety in sensitive areas and geofencing;
- Week 6: ergonomics and prevention of musculoskeletal disorders;
- Weeks 7–12: refresher sessions as needed.
☝️ AntsRoute KPIs (average POD rate, compliant breaks, gap between planned and actual workload, etc.) let managers assess a driver’s progress in real time, in a clear dashboard.
The mentor stays involved until the end of the third month, with a weekly evaluation sheet. The goal: to highlight progress, but also identify weak signals (fatigue, repeated mistakes, loss of motivation) and act quickly.
“We set up weekly monitoring of field feedback via AntsRoute. As a result, we reduced spontaneous departures by 30% in three months,” explains Caroline, the manager of an SME.
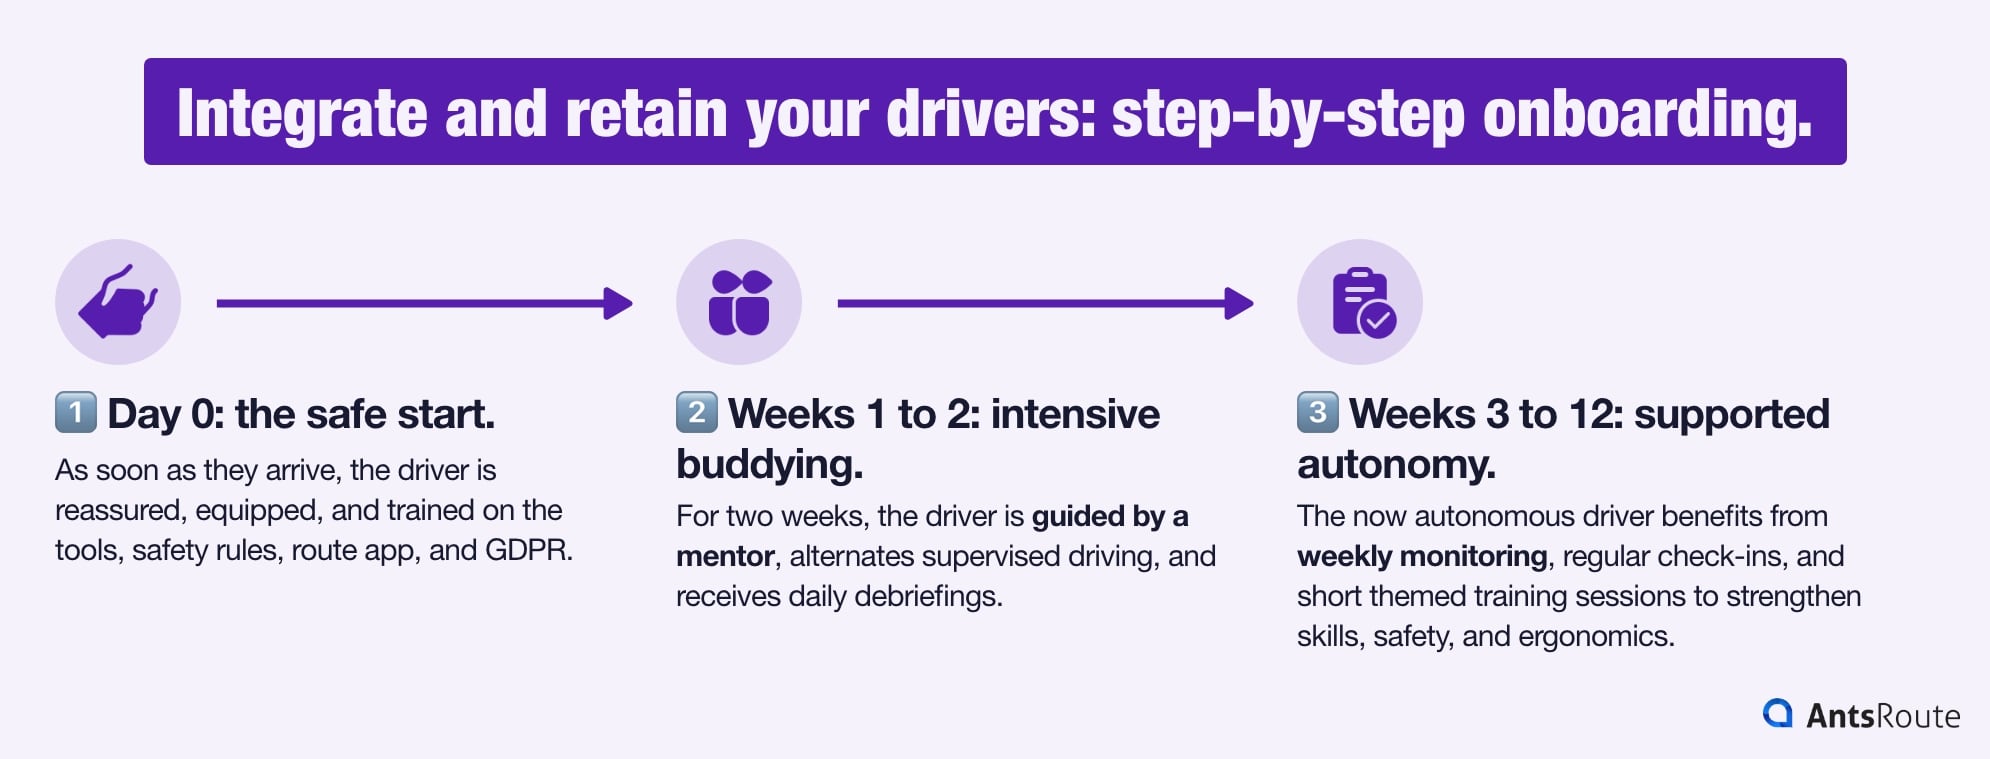
Integrate and retain your drivers: the steps to follow.
Progress “gates”: tracking without pressure
To keep a clear overview, some companies set up milestones:
| Step | Key objectives | Tracked indicators |
| D+10 | Zero major incidents, breaks taken as planned | POD < 60s, ETA drift < 15 min/day |
| D+30 | First-attempt success rate ≥ 92%, balance between actual and planned workload | Weekly AntsRoute KPIs |
| D+90 | Zone stability ≥ 80%, zero major incidents over 60 days | Driver and mentor feedback |
Pay and Employment Status: Why Predictability Keeps Delivery Drivers Longer
If there’s one topic that really sparks debate in the profession, it’s pay. Should drivers be paid per drop, per route, or with a guaranteed stable income? In recent years, the pay-per-drop model has attracted many companies, won over by its apparent simplicity. But behind this apparent efficiency lies one of the hidden causes of massive turnover.
The pay-per-drop model: simple but risky
The pay-per-drop model is appealing: the more you deliver, the more you earn. In theory, it encourages productivity. In practice, it creates financial insecurity and risky behaviour. Between last-minute cancellations, traffic issues, or absent customers, income fluctuates from one day to the next. And this unpredictability, repeated week after week, eventually wears people down.
“Some days I earn €130, other days barely €80. You can’t build a life on that,” says Liam, a self-employed driver for five years.
Under pressure, drivers deliver faster, but often less well: shortened breaks, rushed PODs, avoidable mistakes. The result: growing fatigue and declining service quality.
That said, this model still has advantages in some cases, especially for short and homogeneous jobs: dense routes, standardised deliveries, stable on-site times.
☝️ One of AntsRoute’s strengths is that it enables planners to create realistic, balanced routes, thereby limiting income gaps between drivers. It provides a fairer foundation for stable pay models.
| Advantages | Limits | Ideal for… |
| Simple to understand and manage | Highly variable income | Occasional activities, temporary work, short-term subcontracting |
| Encourages productivity | Risk of burnout, rushed PODs, skipped breaks | Dense networks with repetitive jobs |
The winning model: an hourly floor + quality bonus
For long-term retention, it’s better to bet on predictability. More and more companies are adopting a hybrid model that combines:
- A guaranteed hourly income (security)
- And a quality bonus (motivation)
This system reassures drivers while rewarding their professionalism.
| Element | Detail |
| Guaranteed hourly rate | Example: €16/hour gross on scheduled hours |
| Monthly bonus | Indexed to controllable KPIs: first-attempt success rate, compliance with breaks, POD quality, customer feedback |
| Objective | Provide stable income and motivation based on quality, not speed |
Concrete example:
- Scheduled hours: 160 h x €16/h = €2,560
- Maximum bonus: €200
- KPI score = 82% → Bonus = €164 (€200 x 0.82)
- Total monthly pay = €2,724 (predictable, fair, and motivating)
☝️ AntsRoute supports this hybrid model: by automatically tracking field KPIs (compliance with breaks, first-attempt success rate, complete PODs, etc.), the software feeds the calculation base for quality bonuses with no manual data entry.
Comparison: two models, two philosophies
| Criterion | Hourly floor + quality bonus | Pay per drop |
| Average monthly income | Stable and predictable | Variable and unpredictable |
| Main motivation | Quality, safety, consistency | Speed, volume |
| Risk of overload | Low | High |
| Impact on retention | Very positive | Low |
| Ideal for… | Employed drivers, in-house networks | Temporary assignments, peak activity |
Measure Retention Like a Logistics KPI
You can’t improve what you don’t measure.
If on-time delivery (OTD) is now closely watched in most warehouses, driver retention should get the same level of attention. Because a driver who stays is a driver who knows their area, their customers, and who delivers better. In other words: loyalty is also a performance indicator.
Track retention over time: D+30, D+90, D+180
The first step is to track team stability over time. To do this, you look at cohorts of hired drivers and measure how many are still in post after 30, 90, or 180 days.
| Indicator | Formula | Example |
| Retention D+30 | (Drivers still in post at 30 days / Drivers hired) x 100 | 12 hires → 10 still in post → 83.3% |
| Retention D+90 | (Drivers still in post at 90 days / Drivers hired) x 100 | 8 out of 12 → 66,7% |
| Retention D+180 | (Drivers still in post at 180 days / Drivers hired) x 100 | 6 out of 12 → 50% |
| Churn rate D+30 | 100 – 30-day retention rate | 16,7 % |
☝️ With AntsRoute, these data can be cross-referenced with field indicators: number of routes, kilometres driven, break-compliance rate, incidents, customer satisfaction… Enough to identify the concrete causes of early departures.
A driver leaving isn’t just one less payslip to issue. You have to factor in recruitment time, training, equipment, loss of productivity, and temporary disruption. By adding up these items, you get a key indicator: the cost of churn.
| Cost item | Detail |
| Recruitment | Posting job ads, HR, interviews |
| Training | Training days × cost per day |
| Equipment | Smartphone, PPE, badge, in-vehicle holder |
| Productivity | Replacement’s onboarding/adjustment time |
| Replacement | Overtime / temporary staff |
| Administrative tasks | Termination processing, badge return, payroll adjustments |
Example:
If each departure costs €2,000 and 3 drivers leave the company in a single month, that’s €6,000 in losses – not counting the impact on service quality.
☝️ AntsRoute lets you link HR and financial data with field statistics. This finally allows you to quantify the impact of better retention.
Create a “driver retention” dashboard
Retention then becomes an operational monitoring indicator, just like on-time delivery rates or customer satisfaction.
Here are the most relevant KPIs to track:
| Tracked KPI | Objective | Source |
| Gap between planned and actual workload | Detect unbalanced routes | AntsRoute statistics |
| Overtime on breaks/rest periods | Anticipate driver fatigue in the field | Mobile application |
| Total waiting time per day | Track overload | Route log |
| Complete POD (photo, signature, PIN code) | Measure the quality of service | Mobile application |
| First-attempt delivery success rate | Assess customer satisfaction | Delivery data |
| Field incidents | Identify high-risk areas | Delivery history |
| Turnover rate | Track loyalty by team | HR data |
☝️ AntsRoute centralises these data and displays them as comparable charts by driver or by team. At a glance, managers can spot discrepancies and act before a departure occurs.
Turn gaps into a concrete action plan
Each week, it’s useful to hold a retention meeting: 30 minutes flat to analyse the biggest gaps and trigger corrective actions.
| Step | Example action plan |
| 1. Identify the gaps | Drivers who often exceed break times or experience recurring delays |
| 2. Analyse the cause | Poorly specified address, underestimated waiting time, time slot too tight |
| 3. Correct | Adjust duration, new time slot, update the location |
| 4. Track the effect | Monitor the KPIs the following week |
Retaining your drivers isn’t just about offering a better salary or a performance bonus. It’s about giving them a working environment that is stable, predictable, and respectful. The benefits of AntsRoute:
- Realistic working days,
- Stable schedules,
- Breaks that are respected,
- And drivers who stay because they feel heard and valued.
Don’t wait any longer to try AntsRoute free for 7 days!
➡️ Try our demo
➡️ Check out our pricing
FAQ: your questions about driver retention
By combining sustainable routes, structured onboarding, and real listening to what happens in the field. The key levers: fair planning (breaks, stable zones), strong support during the first 12 weeks, and tracking internal satisfaction with the same rigour as delivery KPIs.
Regulations provide for a 45-minute break every 4.5 hours of driving (HGVs/vehicles over 3.5t), which can be split if needed. For urban delivery routes, it’s recommended to include a fixed lunch break and two micro-breaks.
Yes, because retention starts with planning. On three levels:
- Before the route: Fairness and built-in breaks.
- During: An intuitive app, proof of delivery, and real-time tracking.
- After: Accurate performance statistics and detection of weak signals.
WRITTEN BY

Florine Martin
Florine has been a freelance web copywriter since 2021, writing for a variety of clients in a range of sectors. Since the beginning of 2024, she has been writing articles about logistics for our company, AntsRoute.
Free 7-day trial | No credit card required
Contenu
- Why are Drivers Leaving?
- Never-ending days and sacrificed breaks
- Unpredictability: the real poison for retention
- Ignored weak signals: an underused goldmine of information
- The 6 Golden Rules for a Sustainable Delivery Route
- 1. Share the workload fairly
- 2. Stabilise service areas
- 3. Build in breaks and rest time
- 4. Manage urban constraints: parking, access, safety
- 5. Take skills and certifications into account
- 6. Adapt on-site time to the type of delivery
- Integrate and Retain from Day One: Step-by-Step Onboarding
- Day 0: the safe start
- Weeks 1 to 2: intensive buddying
- Weeks 3 to 12: supported autonomy
- Progress “gates”: tracking without pressure
- Pay and Employment Status: Why Predictability Keeps Delivery Drivers Longer
- The pay-per-drop model: simple but risky
- The winning model: an hourly floor + quality bonus
- Comparison: two models, two philosophies
- Measure Retention Like a Logistics KPI
- Track retention over time: D+30, D+90, D+180
- Calculate the cost of churn: the hidden side of turnover
- Create a “driver retention” dashboard
- Turn gaps into a concrete action plan
- FAQ: your questions about driver retention