25 essential logistics KPIs tracked by AntsRoute
Blog > Product updates > 25 essential logistics KPIs tracked by AntsRoute
25 essential logistics KPIs tracked by AntsRoute
Published on 24 June 2024 • Reading time: 3 min read
AntsRoute offers a wide range of key performance indicators (KPIs) to help you make the best decisions.
Thanks to these transportation KPIs, you can manage your business efficiently and improve your operating results.
Here’s an overview of the key performance indicators available in our AntsRoute route optimization software.
KPIs available on the AntsRoute interface
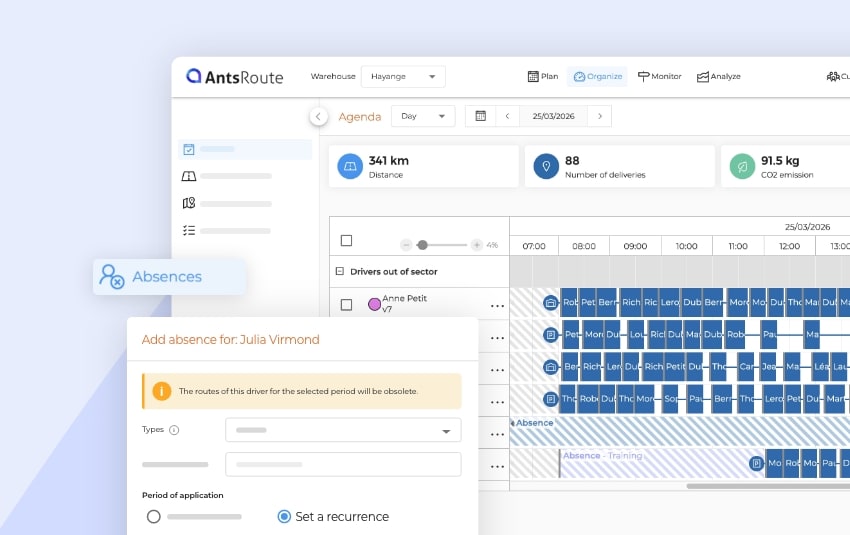
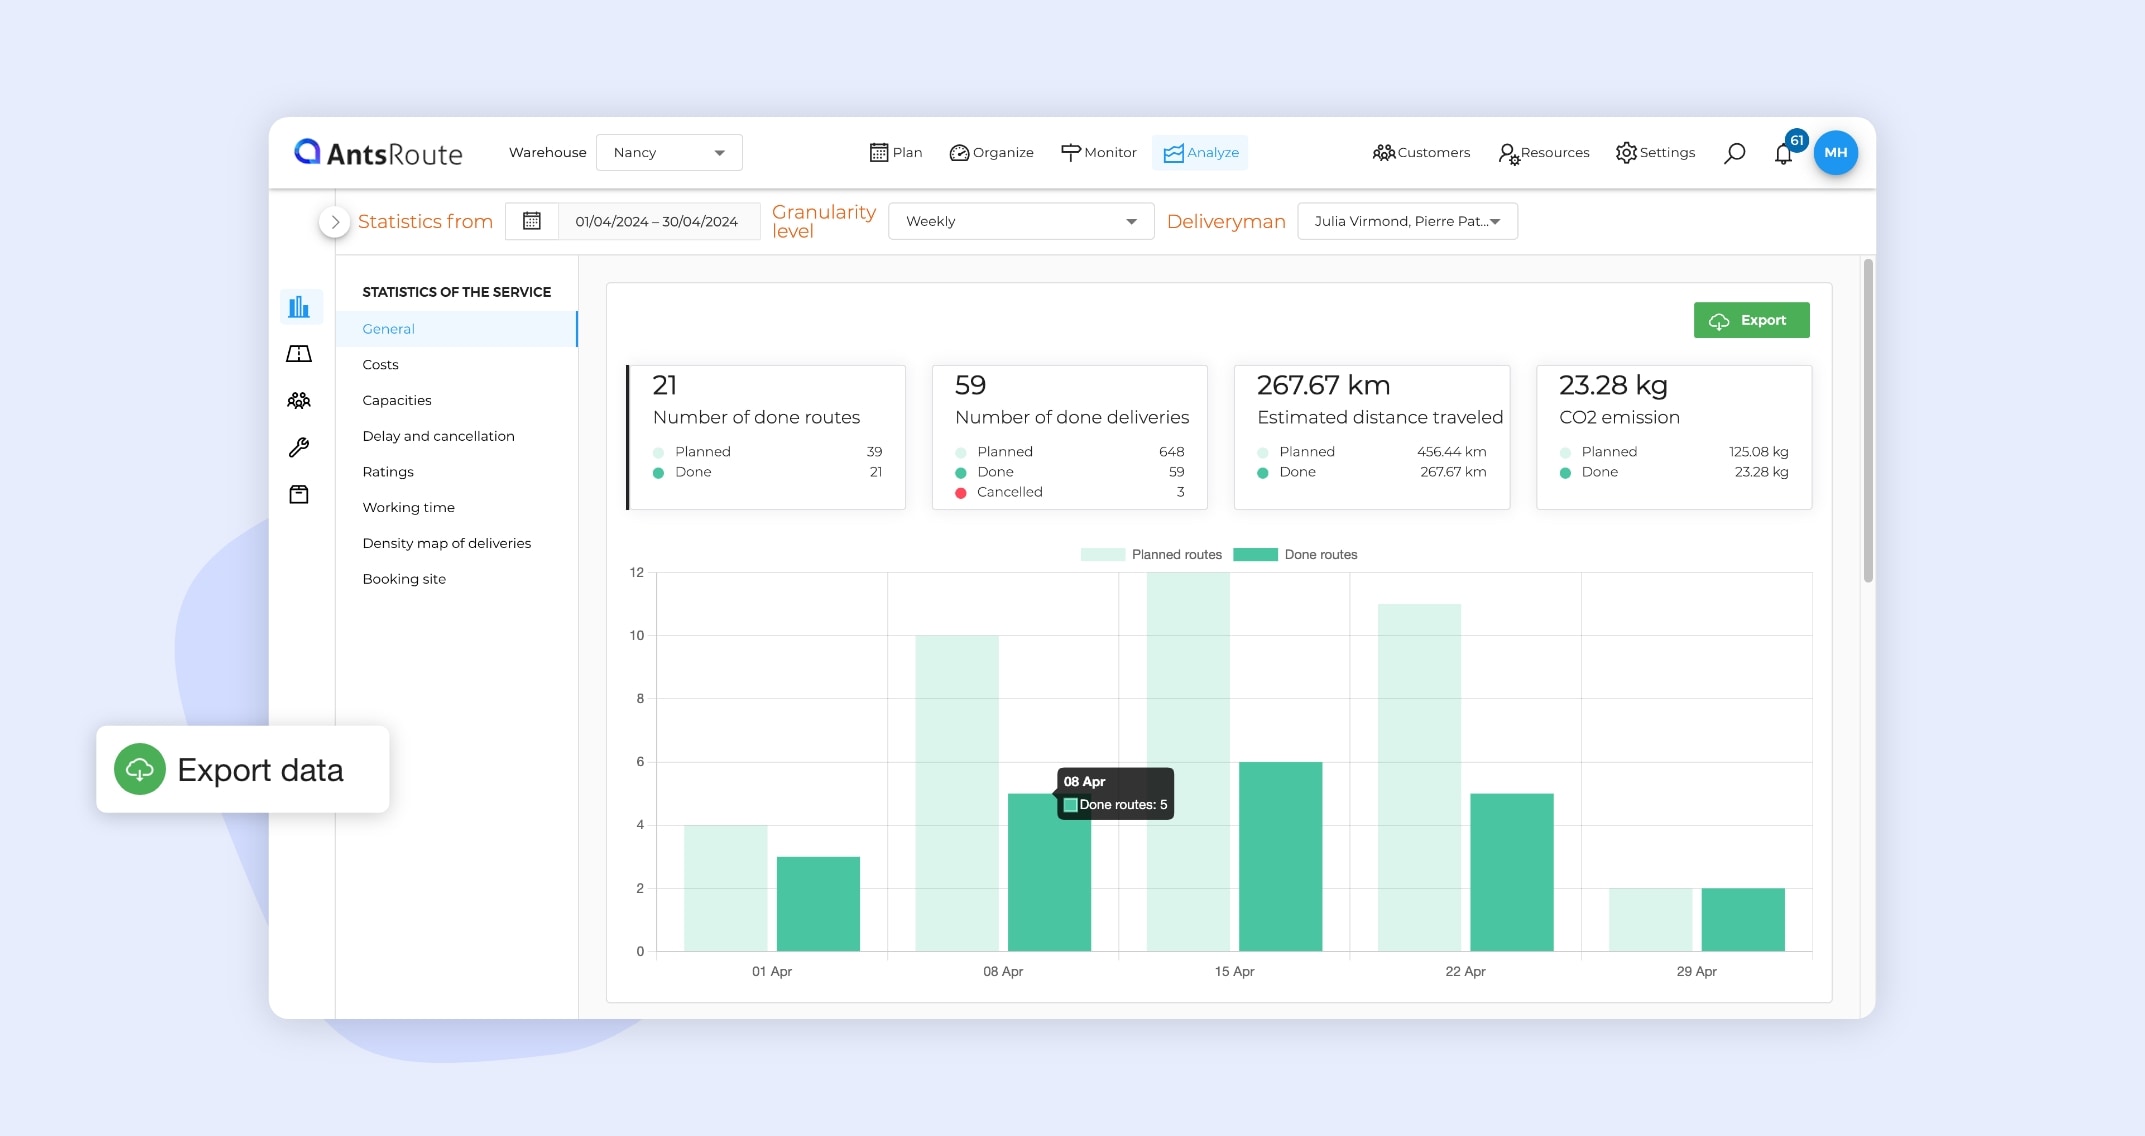
Business volume
- Number of done routes.
- Number of done deliveries.
- Number of deliveries planned from the booking site.
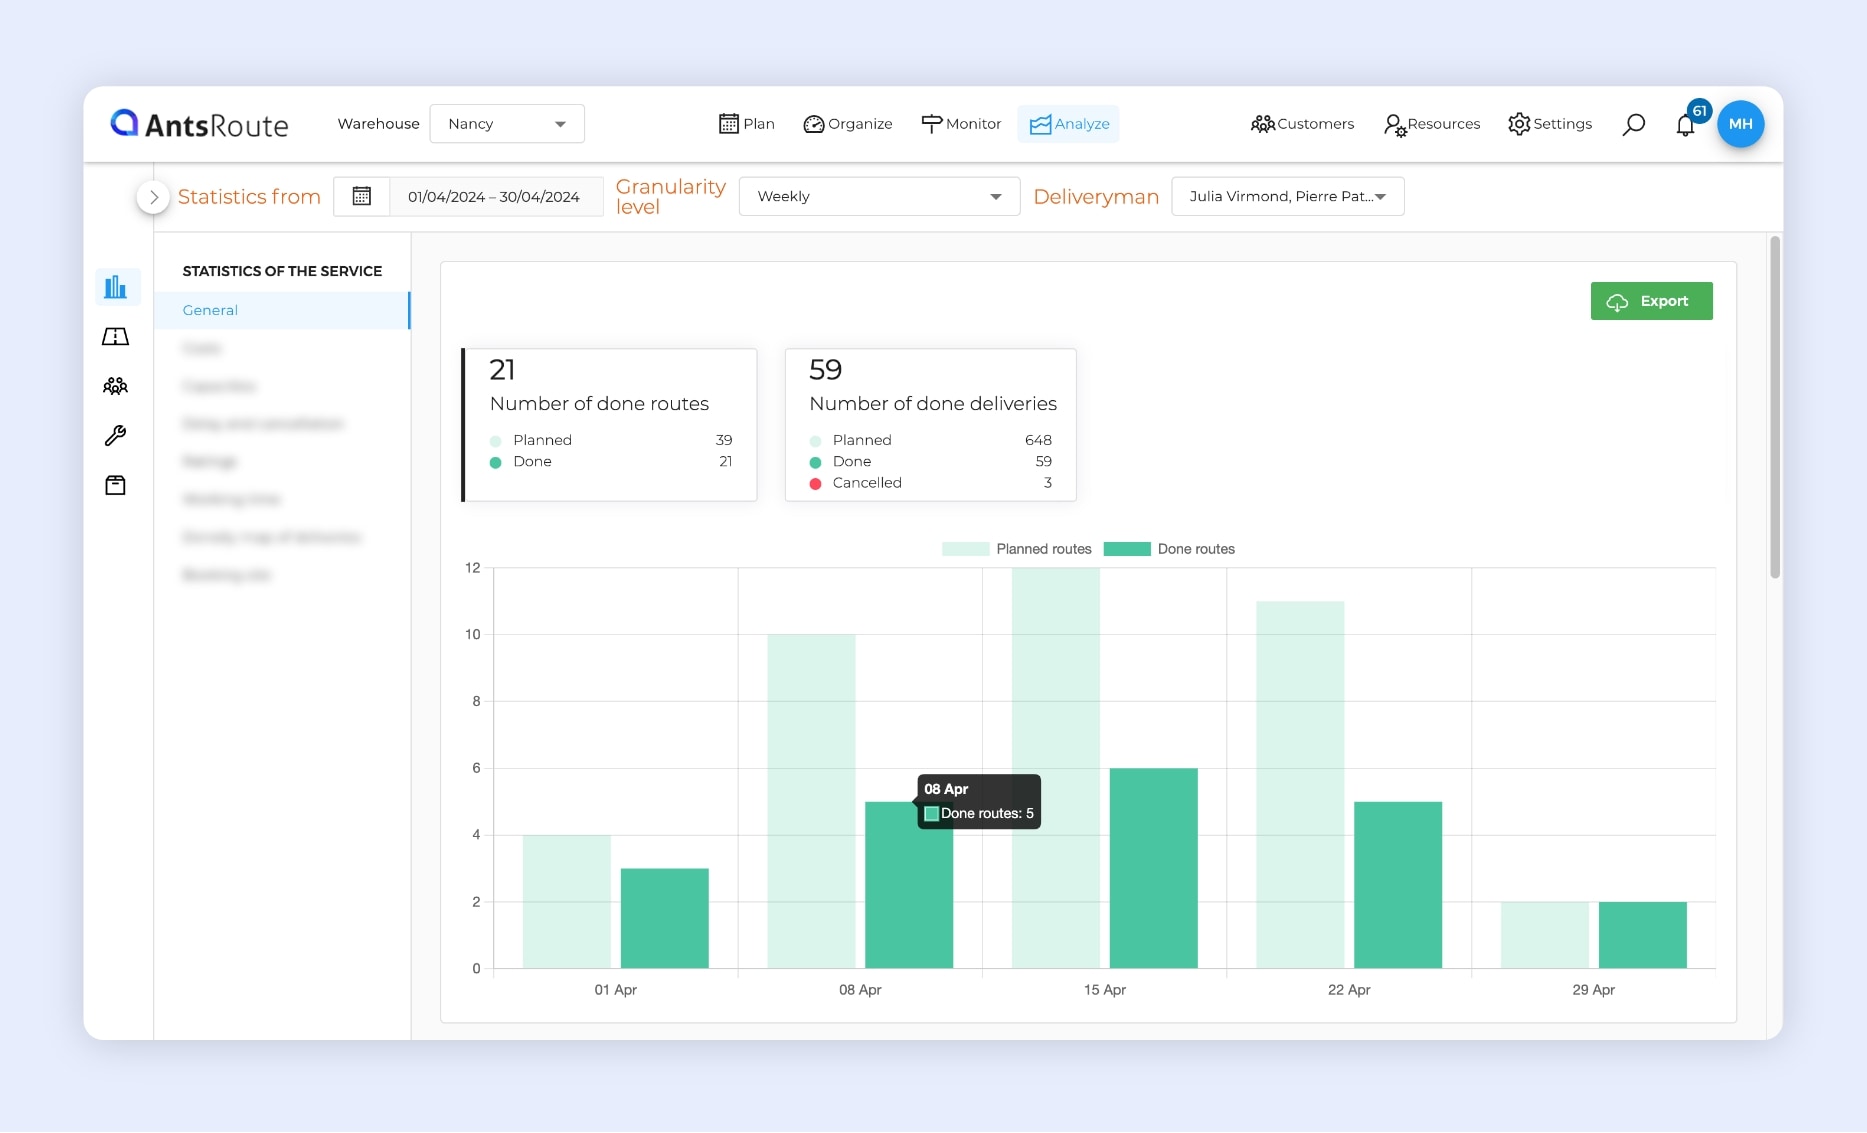
AntsRoute indicators about business volume.
Distances covered
- Estimated distance travelled.
- Average distance per route.
- Average distance per delivery.
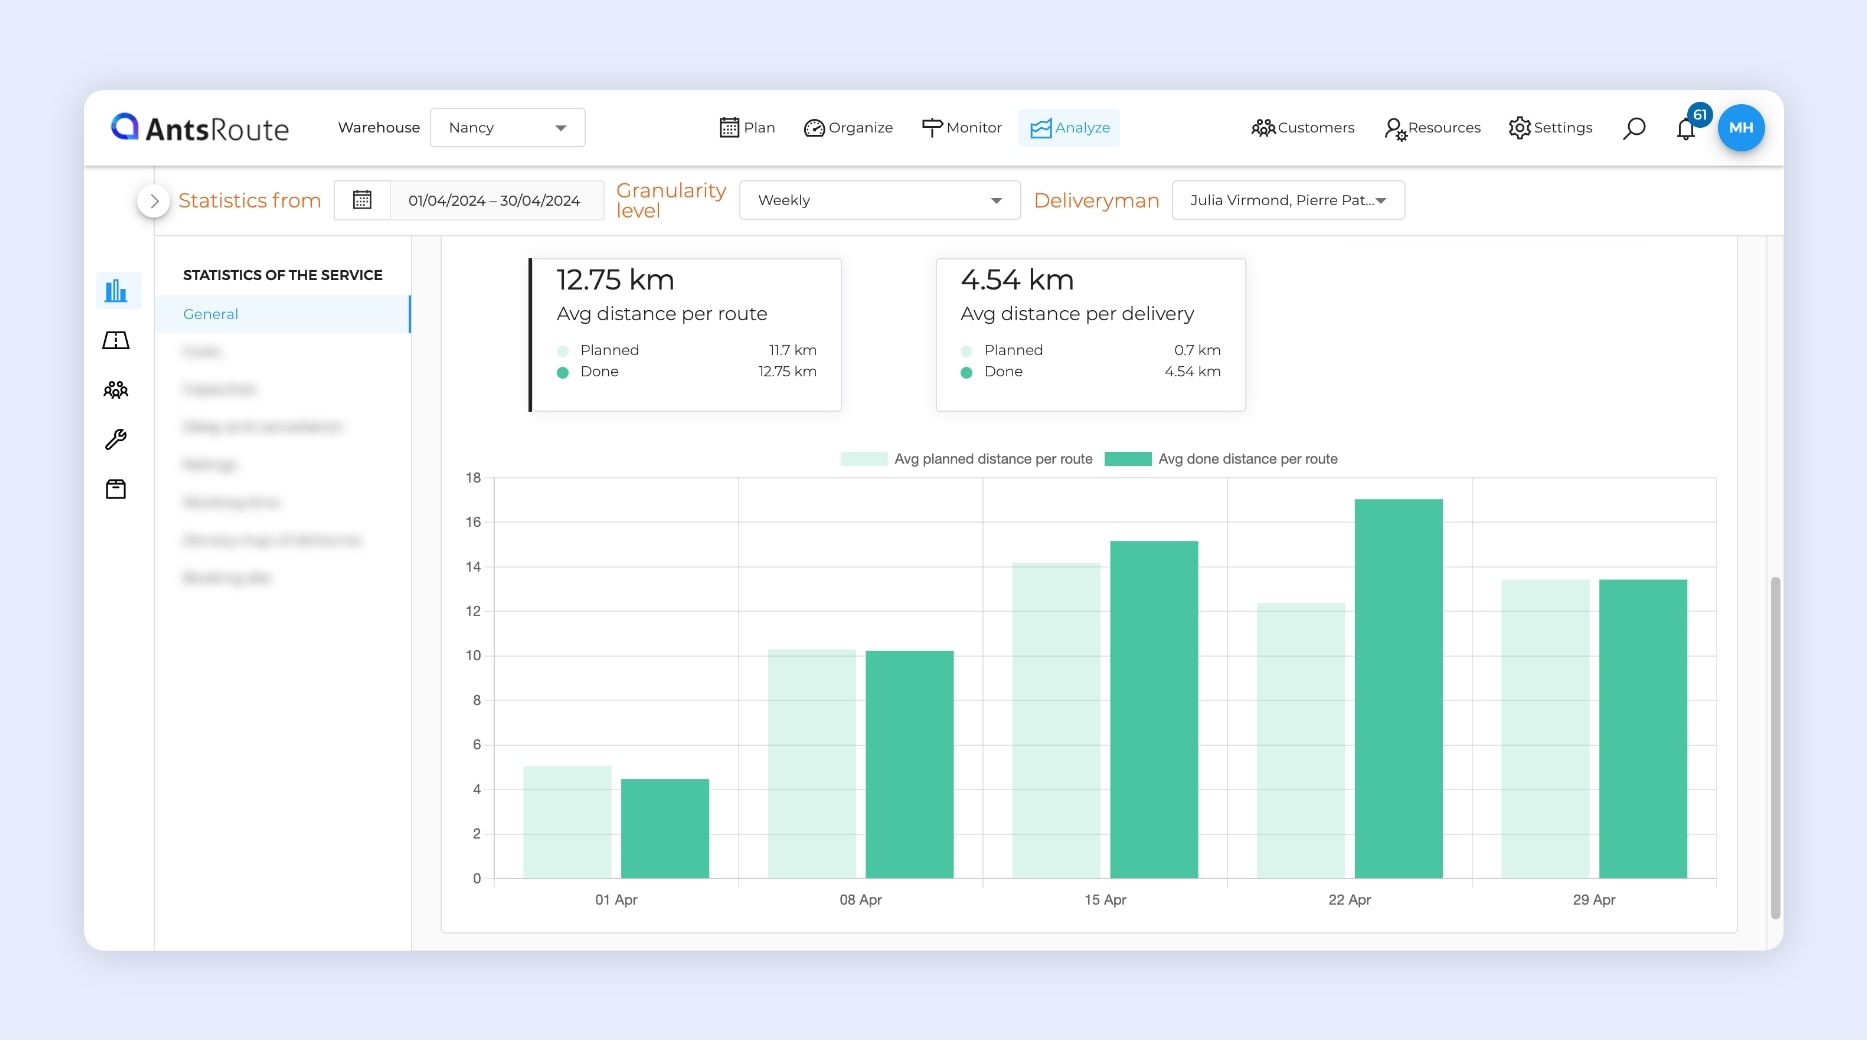
AntsRoute indicators about distances traveled.
Carbon footprint indicators
- Total CO2 emissions.
- Average CO2 emissions per route.
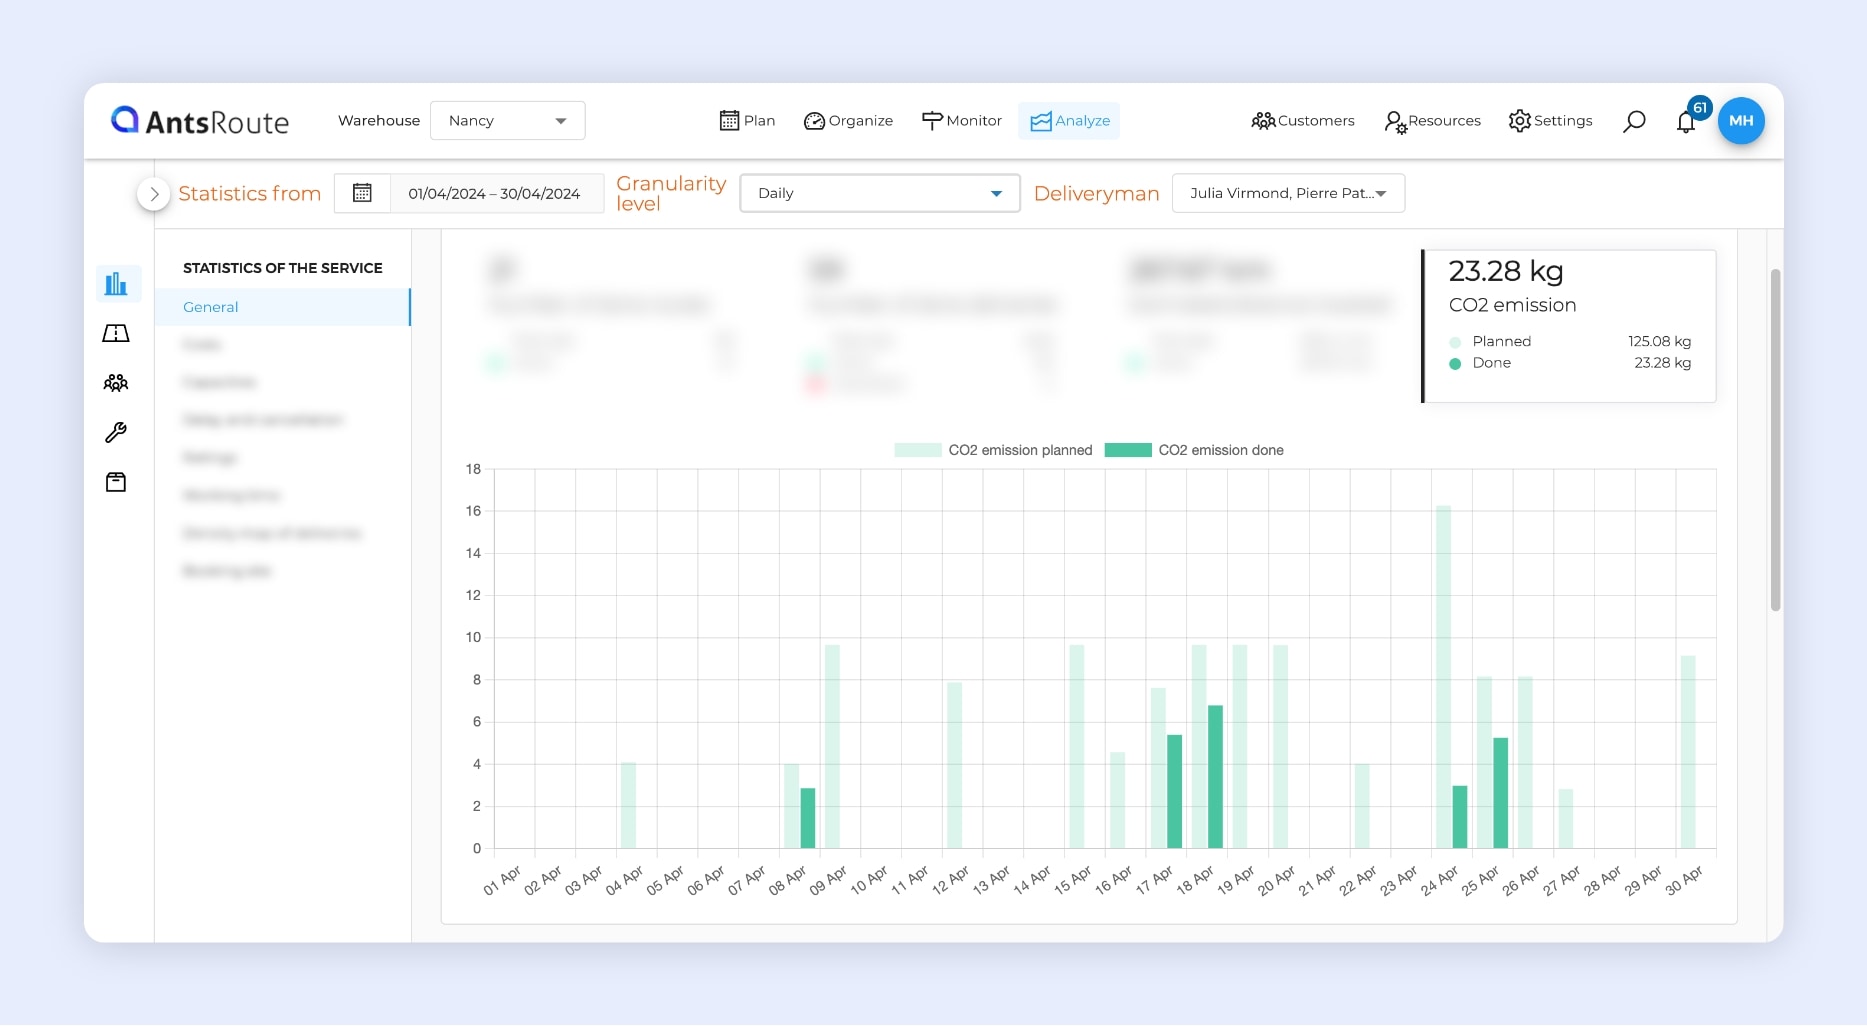
AntsRoute indicators about carbon footprint.
Quality of work
- Average duration of a route.
- Average duration of a delivery.
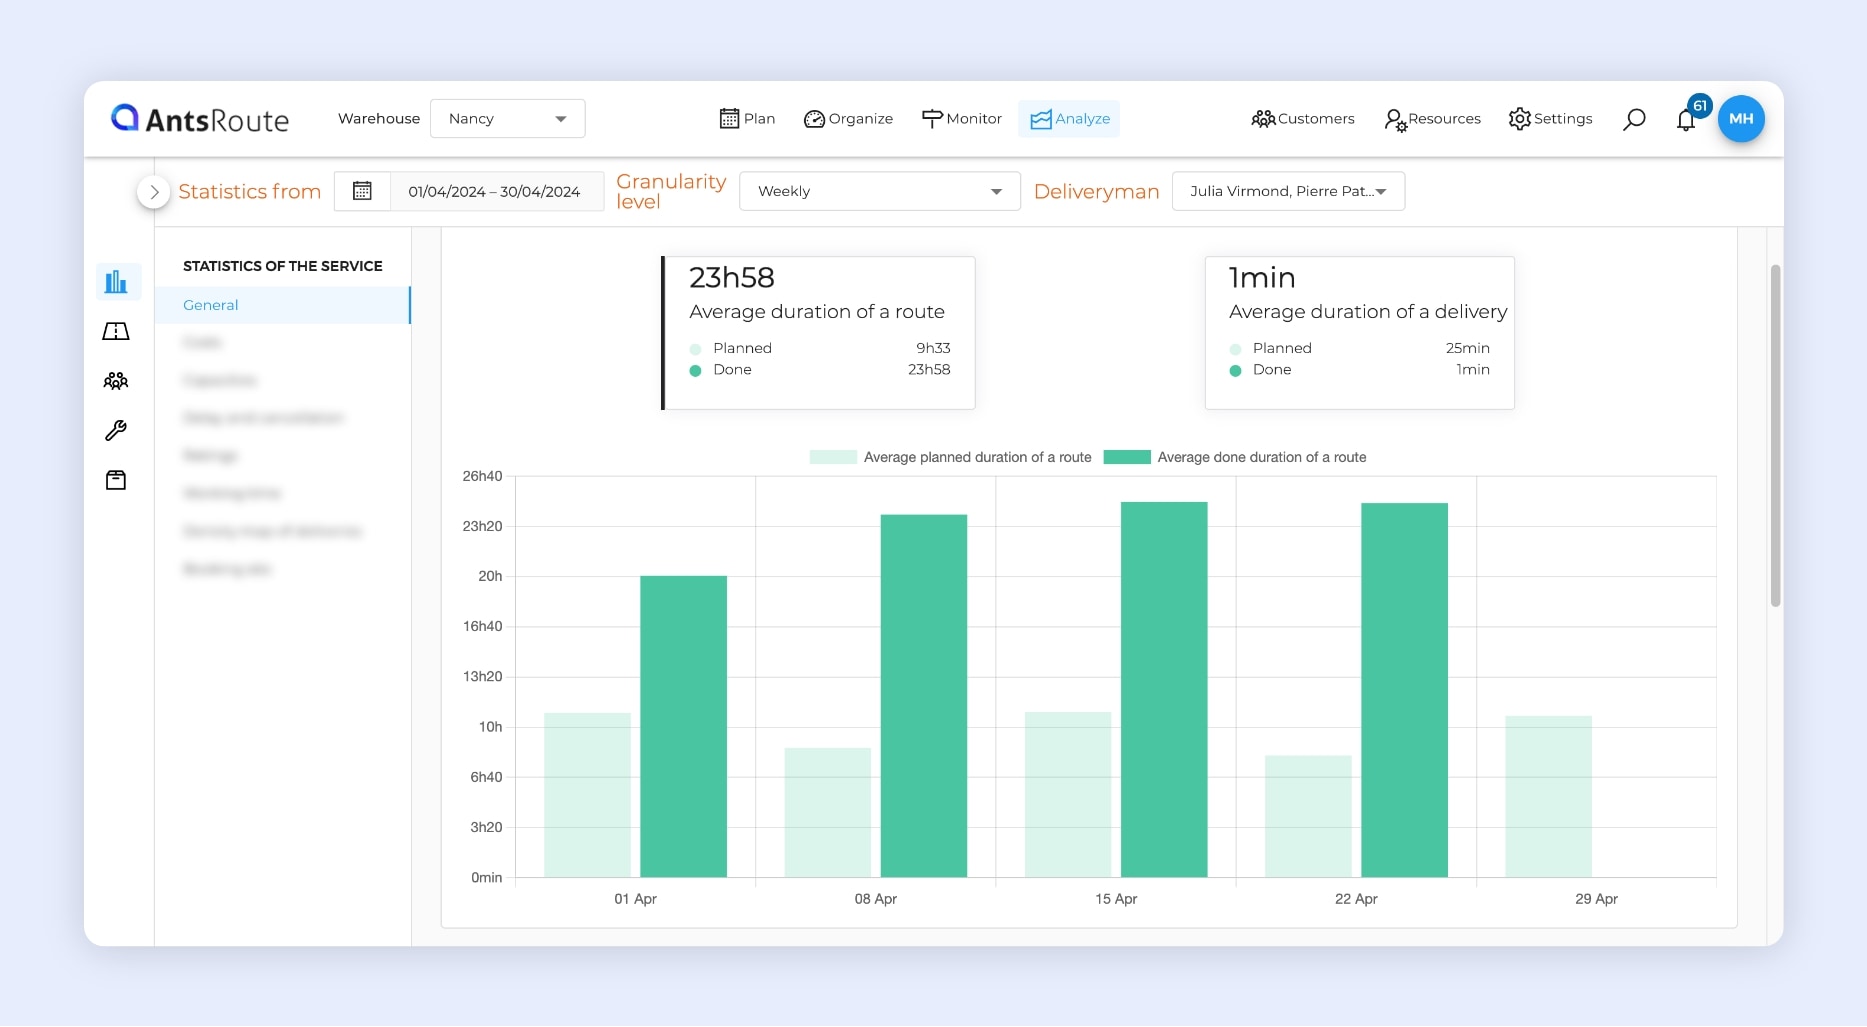
AntsRoute indicators about the quality of work.
Financial indicators
- Total costs of routes.
- Average cost per route.
- Average cost per delivery.
- Total turnover of routes.
- Average turnover per route.
- Average turnover per delivery.
- Total margin of routes.
- Average margin per route.
- Average margin per delivery.
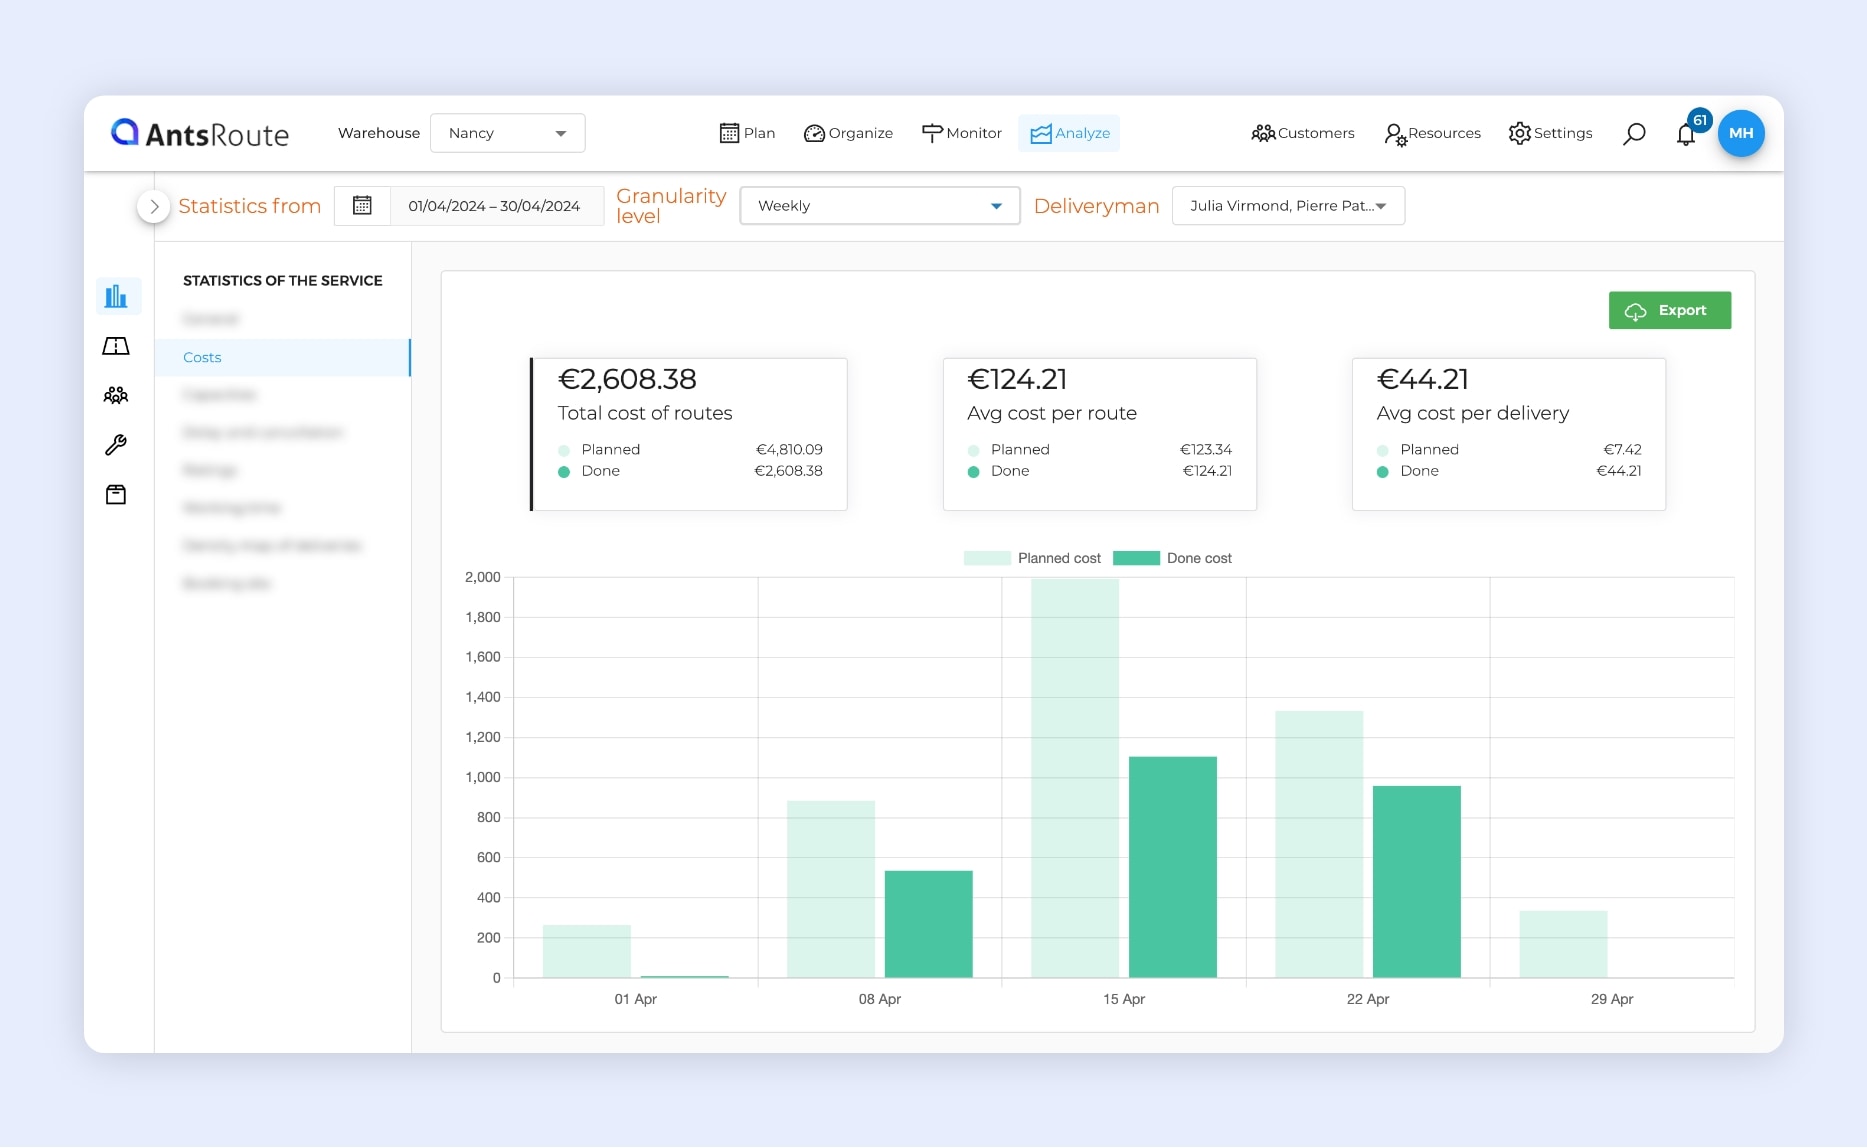
AntsRoute indicators about costs.
Quantity of goods transported
- Carried capacities.
- Average capacity per delivery.
- Average capacity per kilometer.
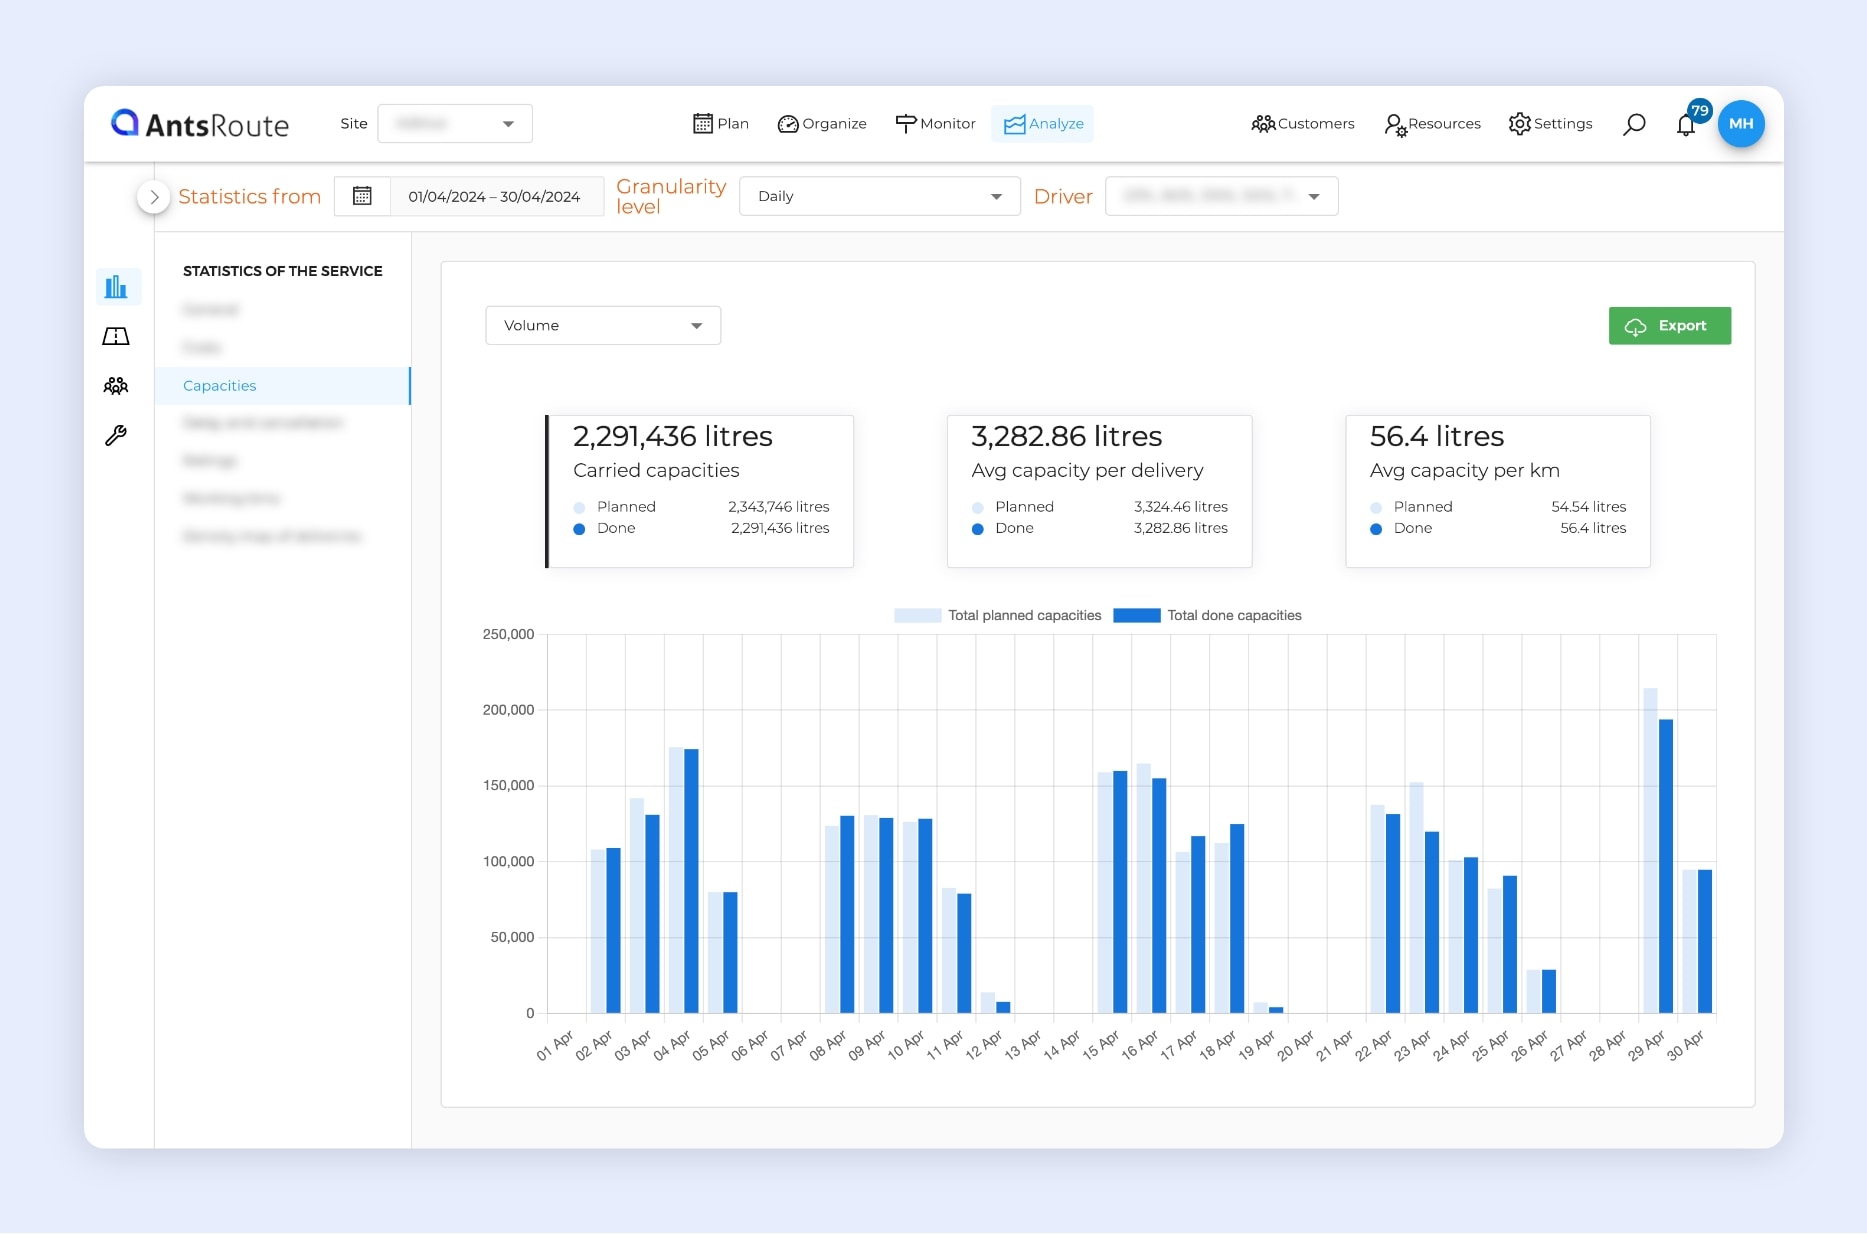
AntsRoute indicators about quantities of goods transported.
Reliability of planning
- Cancellation rate.
- On-time service rate (operation completed within the specified time).
- Reasons for cancellation of deliveries.
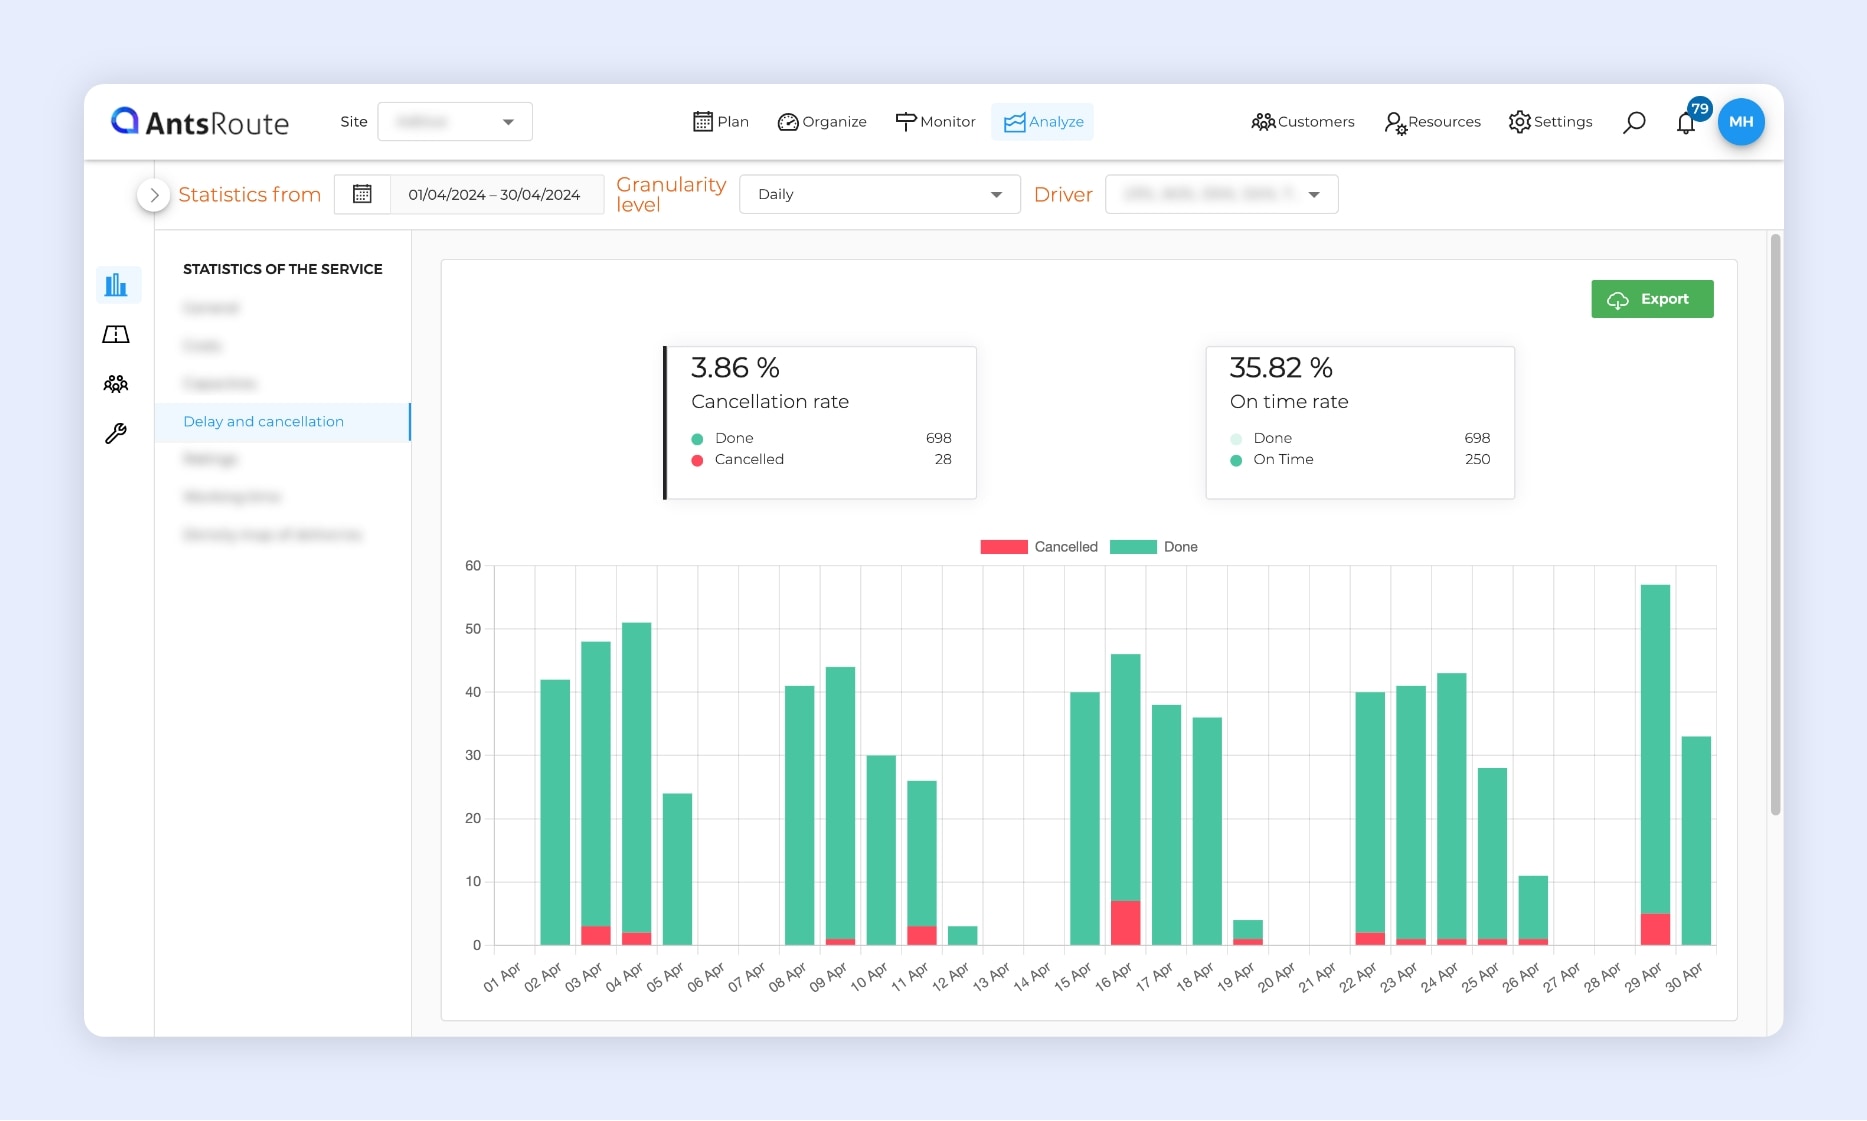
AntsRoute indicators about planning reliability.
Monitoring customer satisfaction
- Number of ratings.
- Average rating.
- Number of ratings with comments.
- Evolution of the average rating.
- Breakdown of ratings.
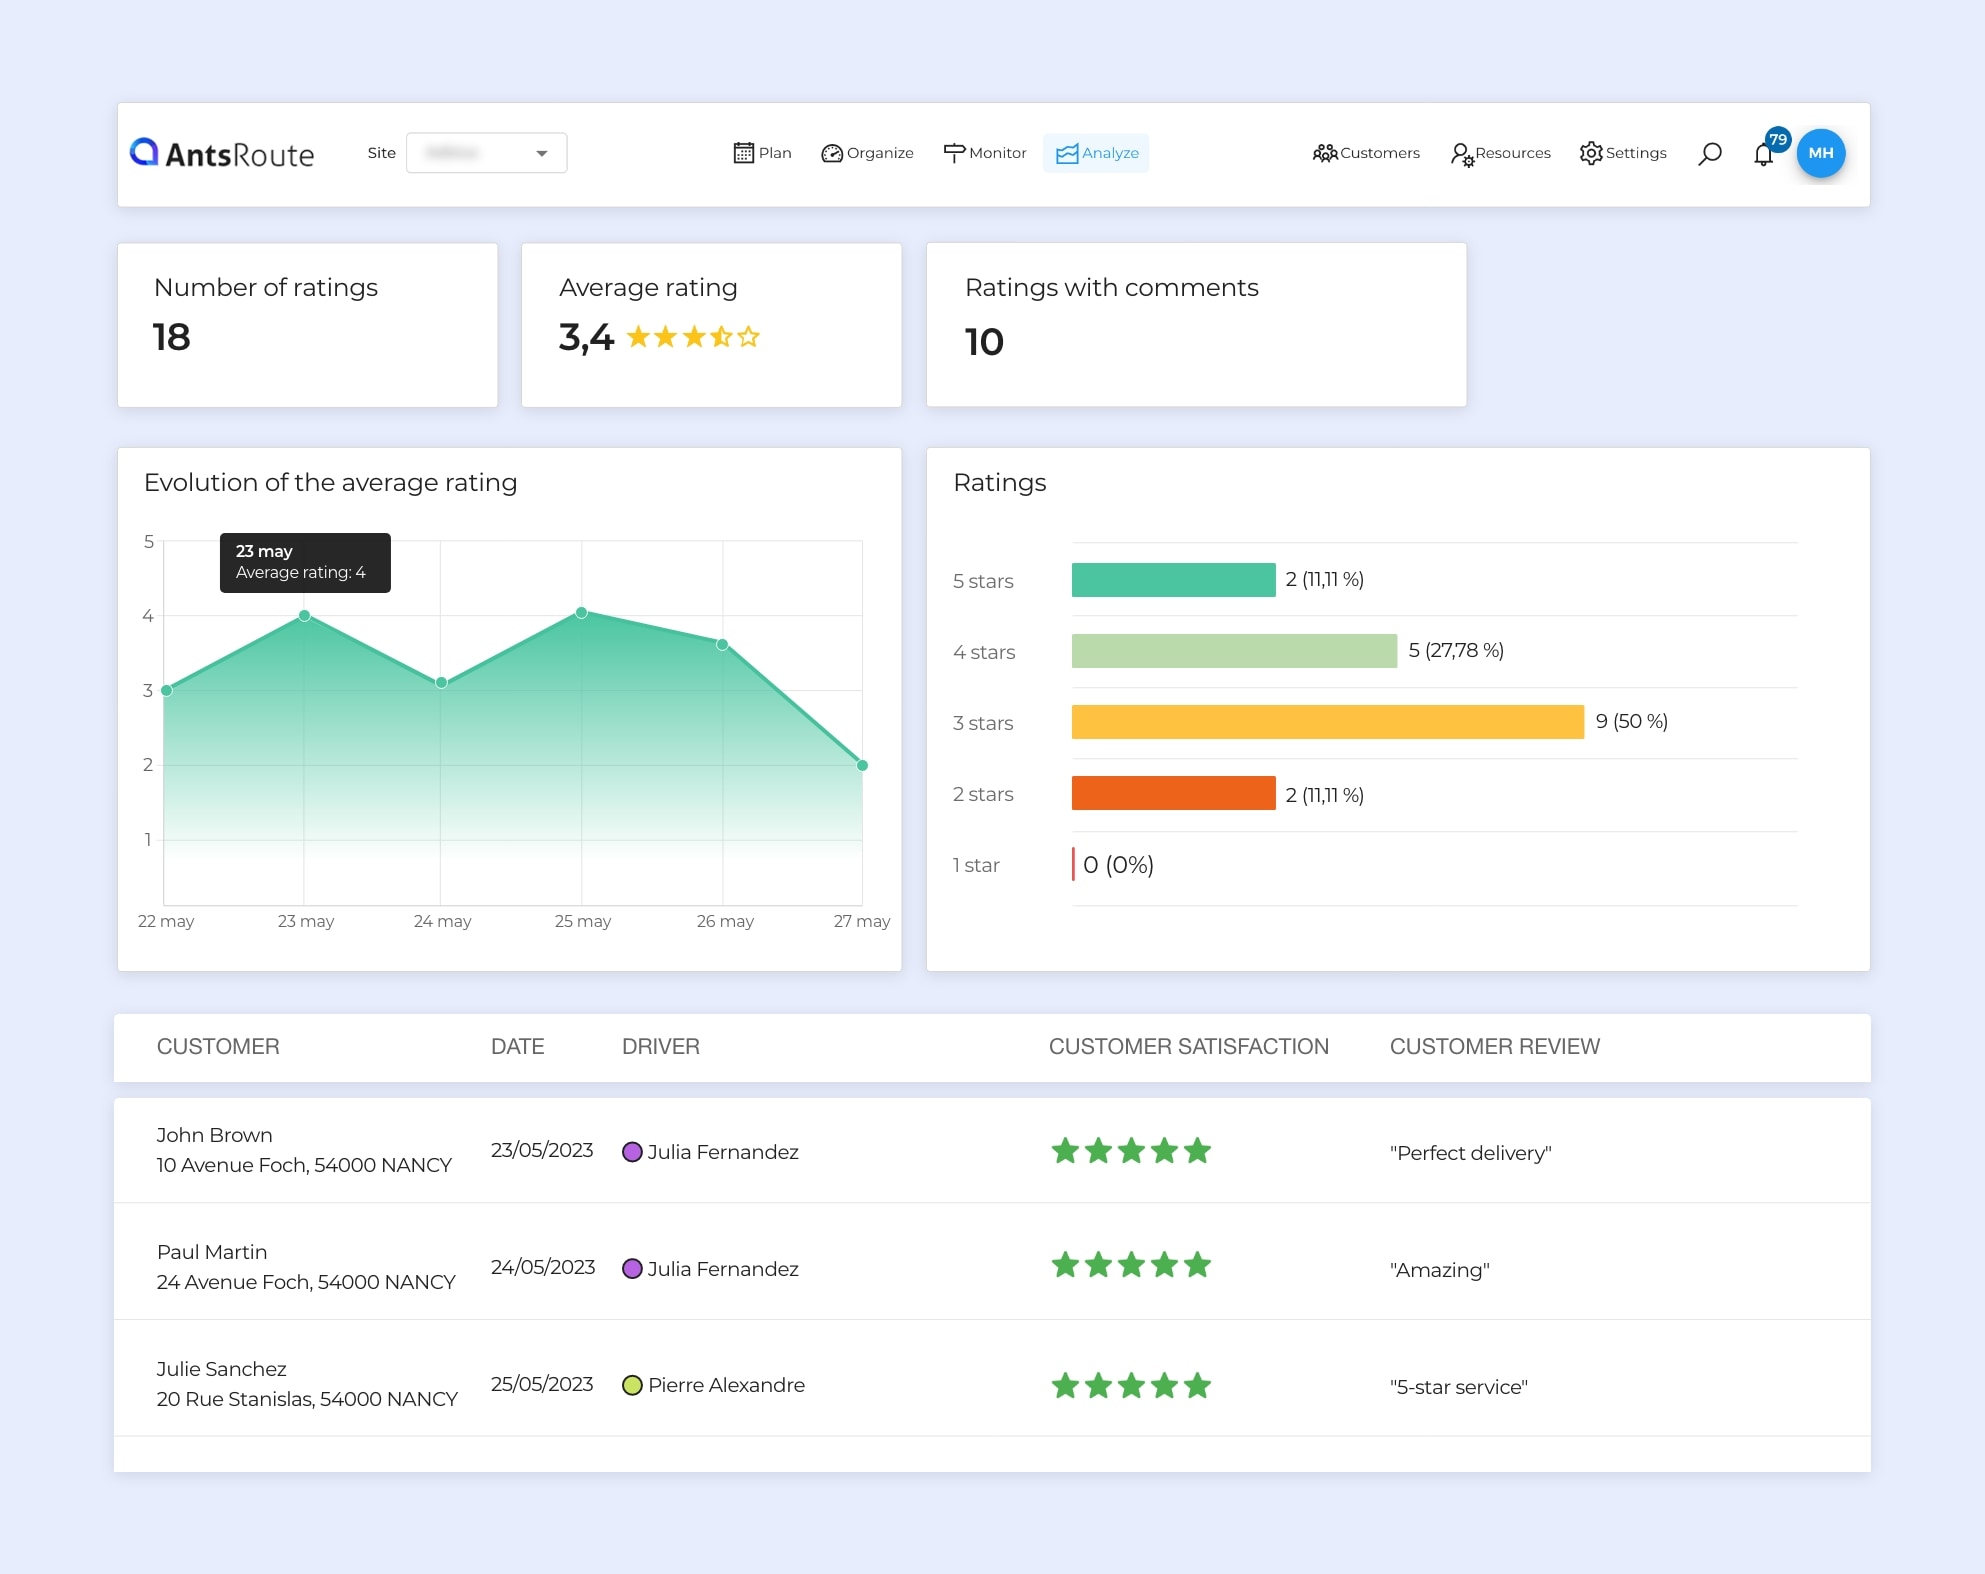
AntsRoute indicators about customer reviews.
Working time for field staff
- Average daily driving time.
- Average daily time with customers.
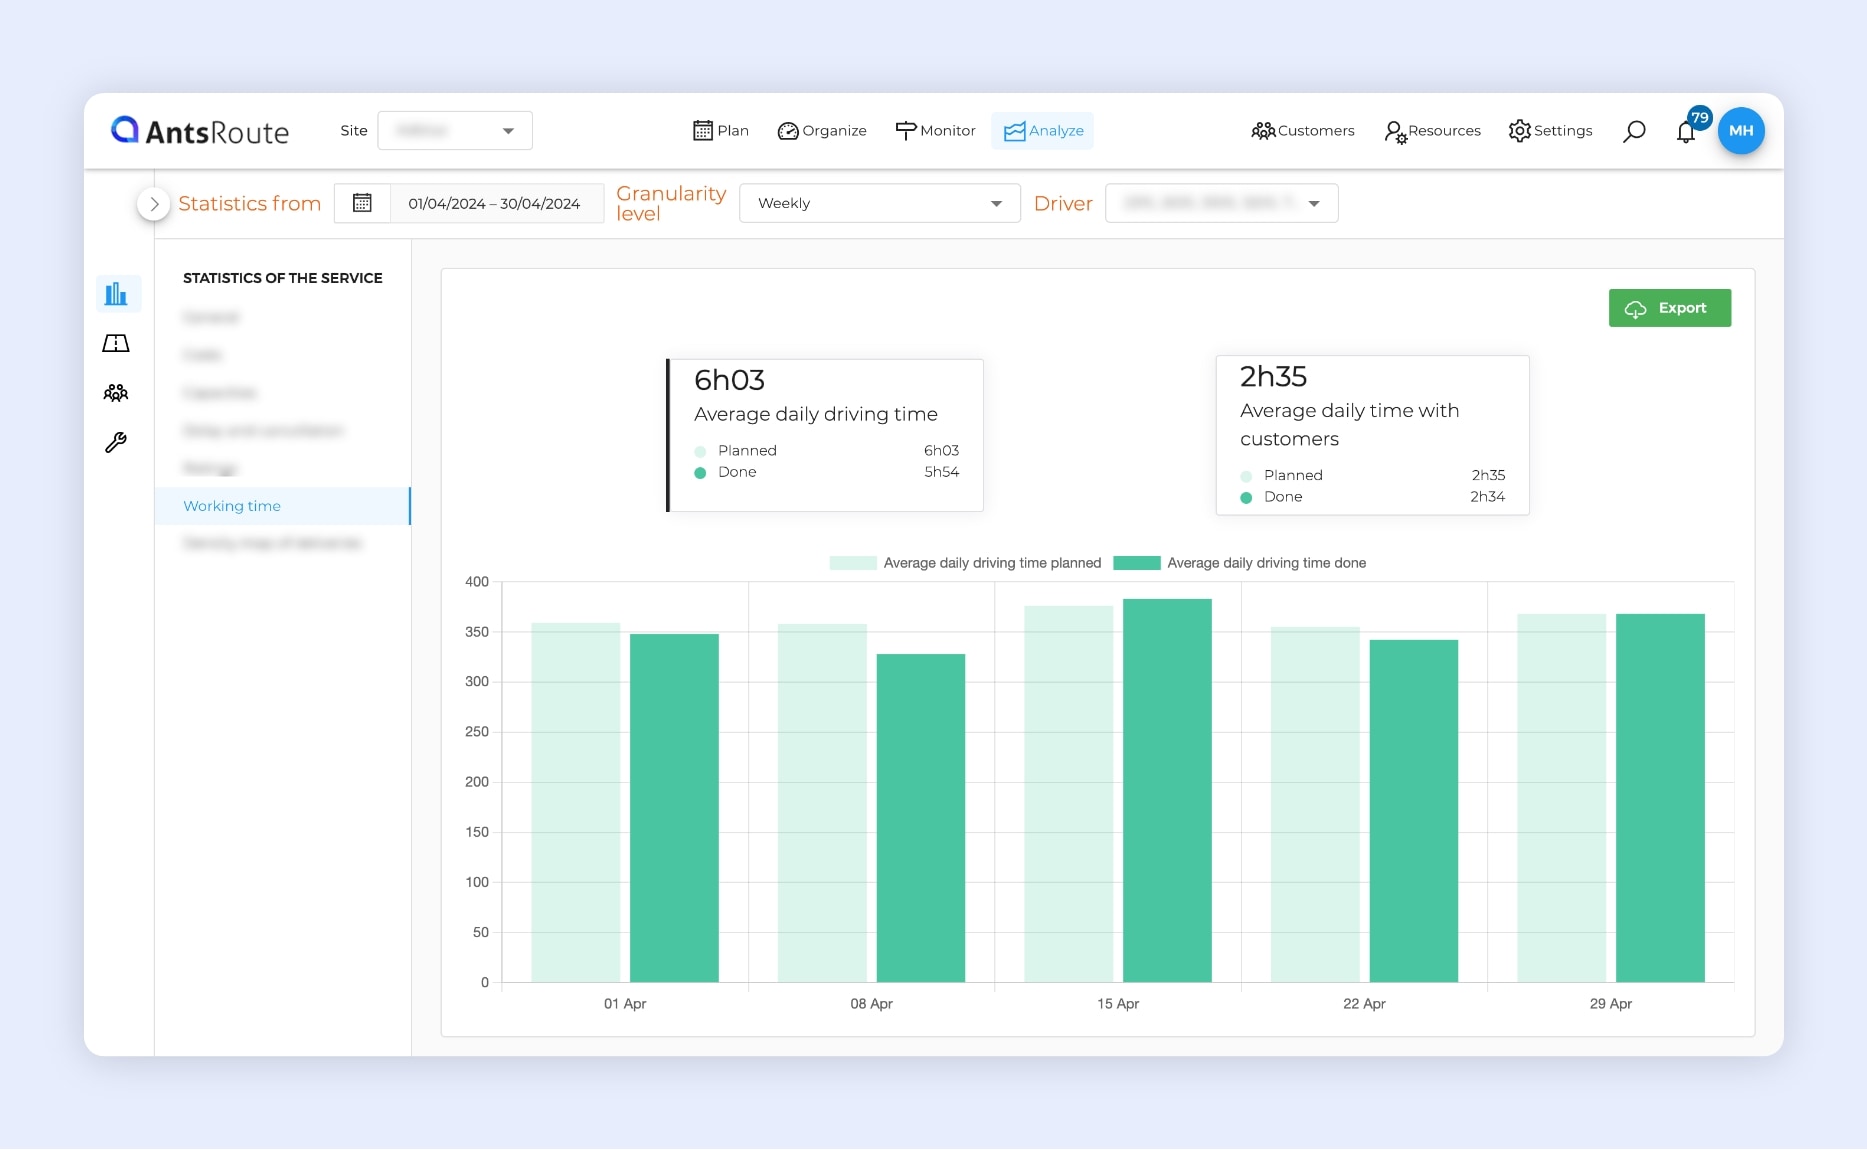
AntsRoute indicators about field staff working time.
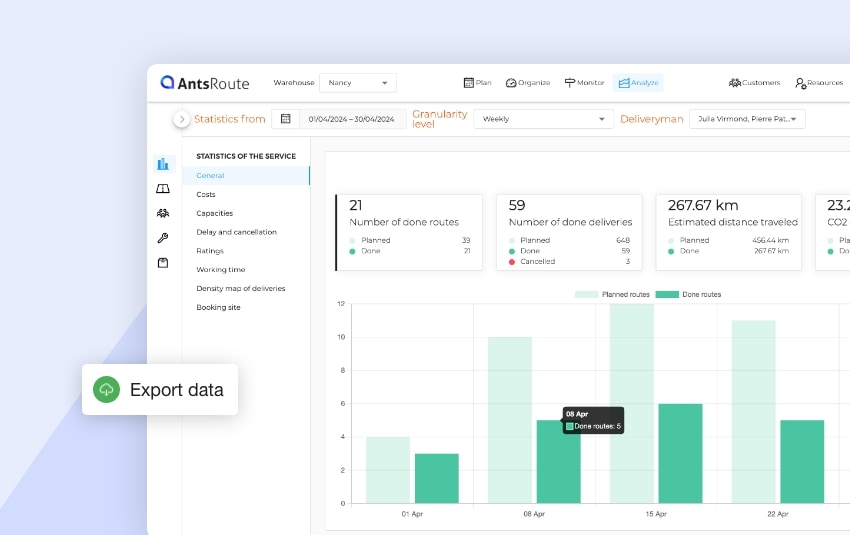
Access these key performance indicators
Our route optimization software manages over 25 KPIs. Thanks to clear, comprehensive dashboards, you can efficiently manage all your transport and field service operations.
The interface also offers several data display options:
- Filter data over a period by selecting a start and end date.
- See how data evolves over days, weeks, months, or years by selecting the frequency for displaying this data.
- Filter data by delivery driver or field worker.
Dashboards can be viewed from the “Statistics” tab in the “Analyze” module.
To try AntsRoute free of charge and with no commitment for 7 days, sign up here.
Optimise your delivery routes today
Free 7-day trial | No credit card required
Contenu
- KPIs available on the AntsRoute interface
- Business volume
- Distances covered
- Carbon footprint indicators
- Quality of work
- Financial indicators
- Quantity of goods transported
- Reliability of planning
- Monitoring customer satisfaction
- Working time for field staff
- Access these key performance indicators
- Optimise your delivery routes today