3 Tips to Optimise your Logistics Service Rate and Boost your Deliveries

The service rate is to some extent the alpha and omega of customer satisfaction. But it is often wrongly summed up as the rate of orders correctly delivered. But it’s much more than that.
Table of contents:
- What is the Logistics Service Rate?
- The 4 Methods for Calculating your Service Rate
- 3 Tips to Optimise your Service Rate
A high logistics service rate guarantees greater customer satisfaction. Efficient delivery improves the customer experience and reduces costs. Better stock management, order picking and route optimisation offer a sustainable advantage.
What is the Logistics Service Rate?
As explained in the introduction, the logistics service rate is often considered to be a company’s ability to deliver properly to its customers. It is calculated as a percentage over a given period. It represents the proportion of orders delivered properly in relation to the total number of orders received.
But what do we mean by delivering properly? Is it on time, with all the products requested and a quality follow-up? Do we take into account packaging defects and possible returns?
There are as many answers as there are calculation methods.
But what really matters is ensuring that your customers are satisfied, without impacting on your costs.
According to a study by SendCloud, 45% of consumers choose a carrier for its punctuality or tracking options. For them, these criteria are more important than delivery speed or cost.
The reliability of its deliveries is therefore essential to ensure customer satisfaction.
But reliability factors vary according to the type of consumer and the products delivered. If you have your goods delivered to your home upon signature, you will attach particular importance to respecting the proposed delivery times. If you have placed an order for an event and some of the products arrive late or slightly damaged, your customer experience will be severely compromised.
For distributors and carriers, late or incomplete requests also have an impact on your costs. They lead to additional deliveries and a reorganisation of your flows, which can have an impact on your margins. The same applies to return rates for damaged or unsatisfactory deliveries: these are just as many products and costs to be reintegrated.
Your priority is therefore to determine the factors that really have an impact on your representatives, your end customers or your company. You can then take them into account when calculating your service rate.

The logistics service rate corresponds to a company’s ability to deliver properly to its customers.
The 4 Methods for Calculating your Service Rate
The calculation of your service rate depends on the factors selected.
As mentioned above, the traditional service rate formula is equal to:
Total orders delivered properly/total orders received x 100
To calculate it, you need to have access to all the orders delivered in a given period. You will then need to check which orders have been delivered properly.
A good service rate varies according to the line of business, but a rate of over 95% is generally considered excellent. Demanding industries such as automotive or electronics may aim for rates close to 99% or even 100%. These ratios are sometimes specified in SLA (service level agreement).
But in this traditional calculation of the service rate, the notion of “proper delivery” is not very detailed.
Indicators have therefore been developed to measure this performance indicator more precisely.
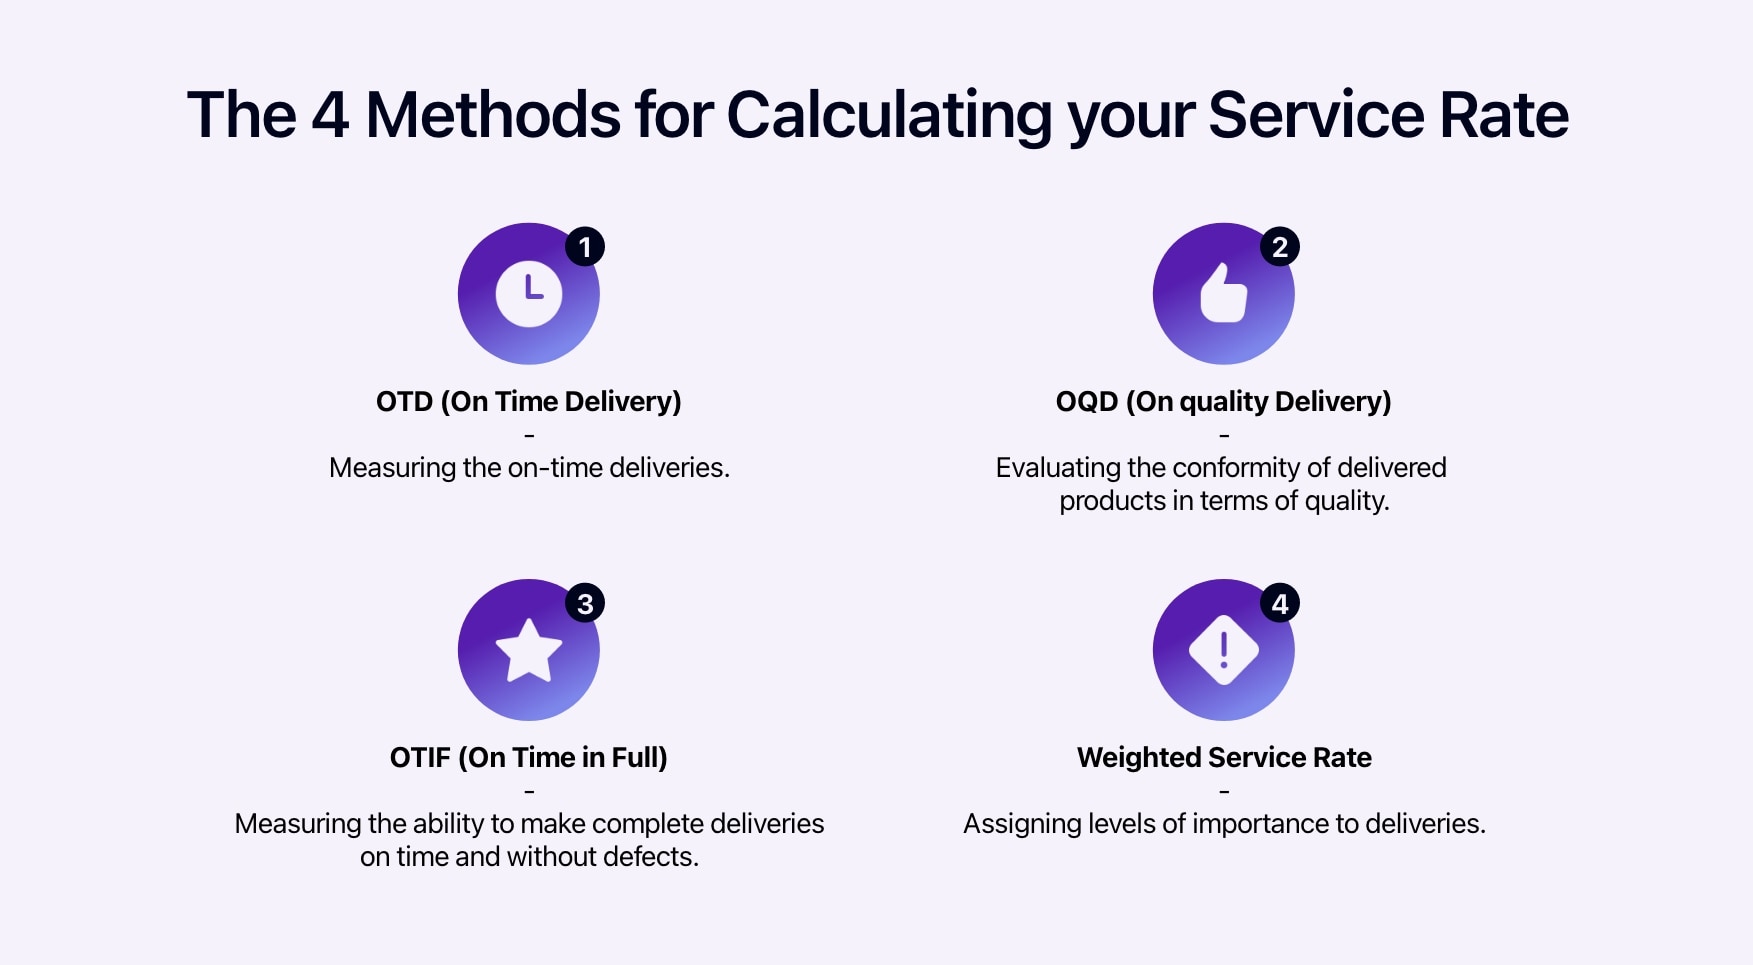
Here are 4 of the most interesting:
- OTD,
- OQD,
- OTIF,
- and the weighted service rate.
Here are the definitions and calculation methods for these 4 indicators. They will help you measure the performance of your deliveries.

Methods for calculating your service rate.
OTD (On Time Delivery)
This performance indicator measures the punctuality of deliveries and any delays. It compares the number of orders delivered on time with the number of orders to be delivered over a given period.
OTD = Number of order lines delivered on time/Total number of order lines to be delivered ×100
It can be calculated in relation to the date requested by the customer (OTDR – On Time Delivery To Request) or in relation to the date promised to the customer (OTDC – On Time Delivery Commit).
OQD (On quality Delivery)
This indicator adds a quality criterion to the measurement of punctuality. It assesses the conformity of products delivered in terms of quality: presence of disputes, defects or returns.
It is calculated as follows:
OQD = Number of order lines delivered on time and without defect/Total number of order lines to be delivered x 100
OTIF (On Time in Full)
This indicator measures the company’s ability to make complete deliveries, on time and without defects. It is often considered the most comprehensive indicator, as it takes into account all aspects of customer satisfaction: punctuality, completeness and quality of deliveries.
It is measured using the following formula:
OTIF = Number of order lines delivered in full, on time and without defects/Total number of order lines to be delivered x 100
The weighted service rate
This indicator is used to assign levels of importance or priority to the criteria selected. Depending on the frequency or value of the items ordered, certain deliveries are more important to the company’s strategy. With this ratio, the company can assign greater weight to these deliveries.
To sum up:
OTD is used to monitor the punctuality of deliveries and identify any delays.
OQD ensures that products delivered meet the quality standards expected by customers, thus reducing disputes and returns.
OTIF combines aspects of punctuality, completeness and quality. It provides an overview of the company’s logistics performance and customer satisfaction.
The weighted service rate assigns a different level of importance to certain products, customers or criteria. It enables you to focus on data of high value to the company.
3 Tips to Optimise your Service Rate
The service rate, and particularly the OTIF, therefore offers a global view of a company’s service quality. As such, it highlights many organisational aspects.
To improve the punctuality, quality and completeness of your deliveries, you need to look at various areas of your organisation, while taking care not to multiply your costs.
1. Optimised Stock Management for Greater Operational Efficiency
To ensure on-time deliveries, it is important to have sufficient stock.
Although this is not a matter for the carrier, it is very much on the minds of logisticians and distributors.
The storage has a significant cost that needs to be anticipated. It may be a good idea to calculate a service rate for each product, so as to be able to monitor as closely as possible any differences with customer expectations.
By analysing the turnover frequency of your products (ABC Inventory Method analysis), you can also identify products that are in high demand. It will then be easier for you to ensure the availability of priority products.
You should also look at the sales lost due to stock-outs. Compare them with the storage costs for these products. This will help you decide whether or not to increase stocks.
An advanced Warehouse Management System (WMS) will also help you to optimise your stock management.
2. Better Prediction, Traceability and Preparation of Orders for Greater Flexibility
To be able to predict the right level of stock, you need to anticipate future orders. Data analysis and predictive modelling, supported by AI, are a great help here.
The automation of picking and packing processes also helps to increase efficiency and reduce picking and delivery errors.
But the responsibility of logistics experts does not stop there. They also need to be sure that all orders are on their way and go through the right supply channel (click and collect, fast delivery, etc.). Control towers (OCT), such as those from WIMO, enable orders to be tracked and the reason why they are blocked to be seen at a glance. With the right OMS software, you can send orders directly to the right warehouse and distribution channel to fill any missing orders. A lot of delay and waste can be avoided in this way.

Efficient stock management ensures on-time deliveries.
3. The digitisation of Transport Flows and Route Optimisation for Greater Responsiveness
That’s where you come in as a shipper or carrier. With the help of a TMS or route optimisation software, you can optimise transport management, from warehouse to final delivery. These applications make it easier for you to choose the right mode of transport (road, air, sea, etc.). They take into account fixed and variable costs and optimise transit time and total cost.
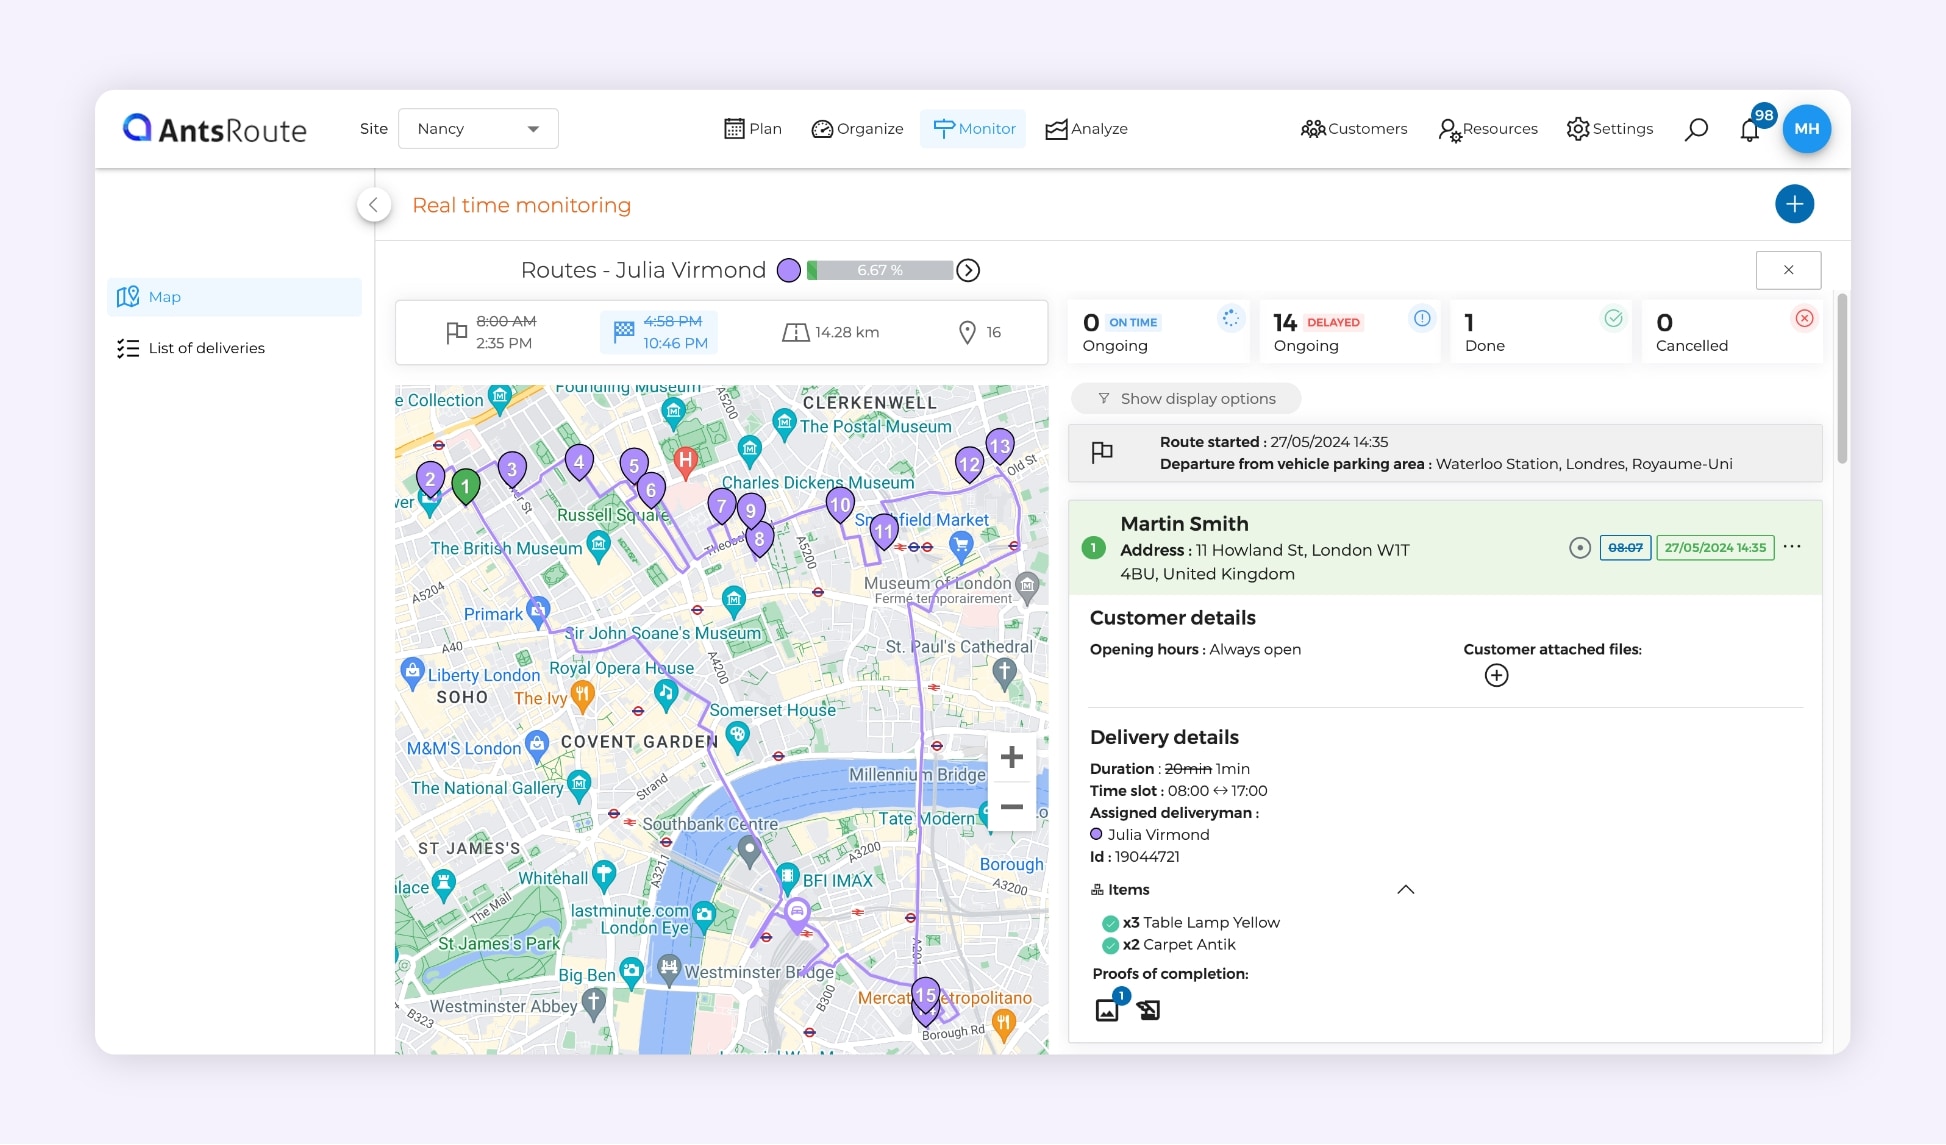
With route optimisation software like AntsRoute, you can also automate the management of your schedules and routes using your own data: delivery locations, working hours, driver availability, vehicle capacity, requested returns, emergencies, etc. This is a real plus for reducing your mileage and costs and ensuring the reliability of your deliveries.

AntsRoute route optimisation software.
By going paperless, you can also offer your customers a personalised experience and follow-up.
On AntsRoute’s online booking site, your customers can choose a delivery time directly. They then receive notifications to confirm or reschedule the visit and track the driver’s arrival.
This is not just anecdotal. This ability to choose and modify automatically greatly facilitates the success of deliveries. It therefore plays an important role in increasing your service rate and customer satisfaction.
Increasing your service rate is a team effort, which requires sufficient data to be collected. But with the right software, it can be improved very quickly, to the satisfaction of your customers.
If you’re interested in this topic, we’ve listed the other KPIs you need to improve your logistics management in another article.
Free 7-day trial | No credit card required
Contenu
- What is the Logistics Service Rate?
- The 4 Methods for Calculating your Service Rate
- OTD (On Time Delivery)
- OQD (On quality Delivery)
- OTIF (On Time in Full)
- The weighted service rate
- 3 Tips to Optimise your Service Rate
- 1. Optimised Stock Management for Greater Operational Efficiency
- 2. Better Prediction, Traceability and Preparation of Orders for Greater Flexibility
- 3. The digitisation of Transport Flows and Route Optimisation for Greater Responsiveness


