

Delivery KPI analysis to improve your performance
Analysing your deliveries isn’t about accumulating data. It’s about understanding what actually happened in the field, identifying gaps and improving your operations.
AntsRoute turns your route data into clear, actionable KPIs. You can measure the actual performance of your deliveries, identify areas for improvement and make decisions based on reliable data.
7-day free trial. No commitment.
Data that genuinely helps you manage your operations
Pass times, delays, failed deliveries, distance travelled… You already have a wealth of data on your operations.
But when this data is spread across several tools, difficult to analyse or reviewed too late, it remains of limited use day to day.
With AntsRoute, information from your routes is centralised to help you track performance, identify gaps and know where to take action.
Delivery KPIs thus become genuine management tools, rather than simply figures in a spreadsheet.
Indicators based on actual execution
Analyse what actually happened in the field.
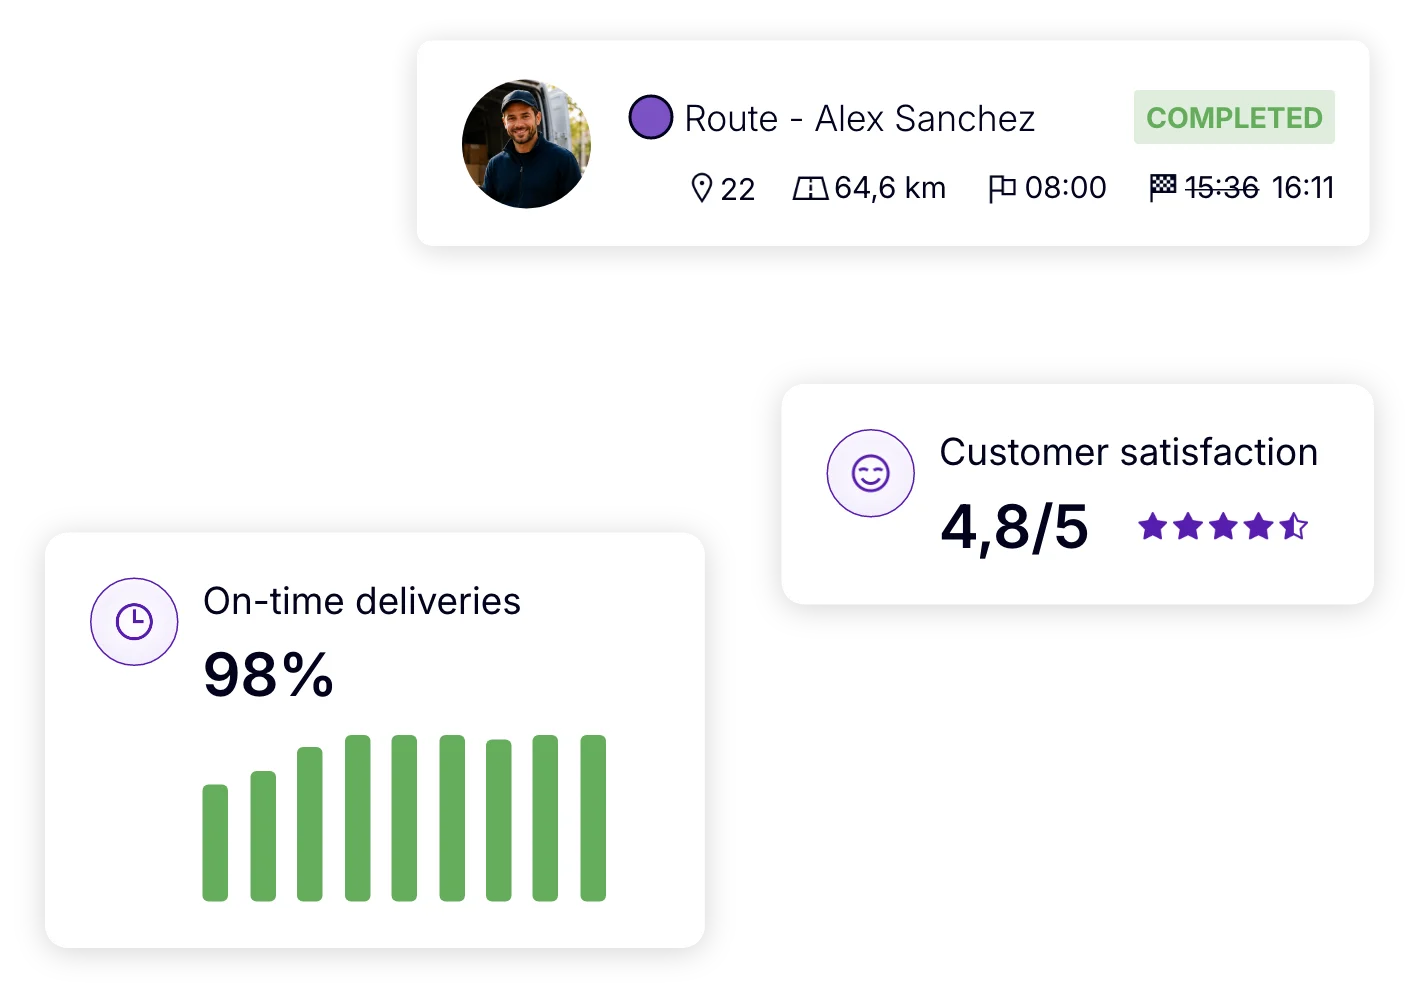
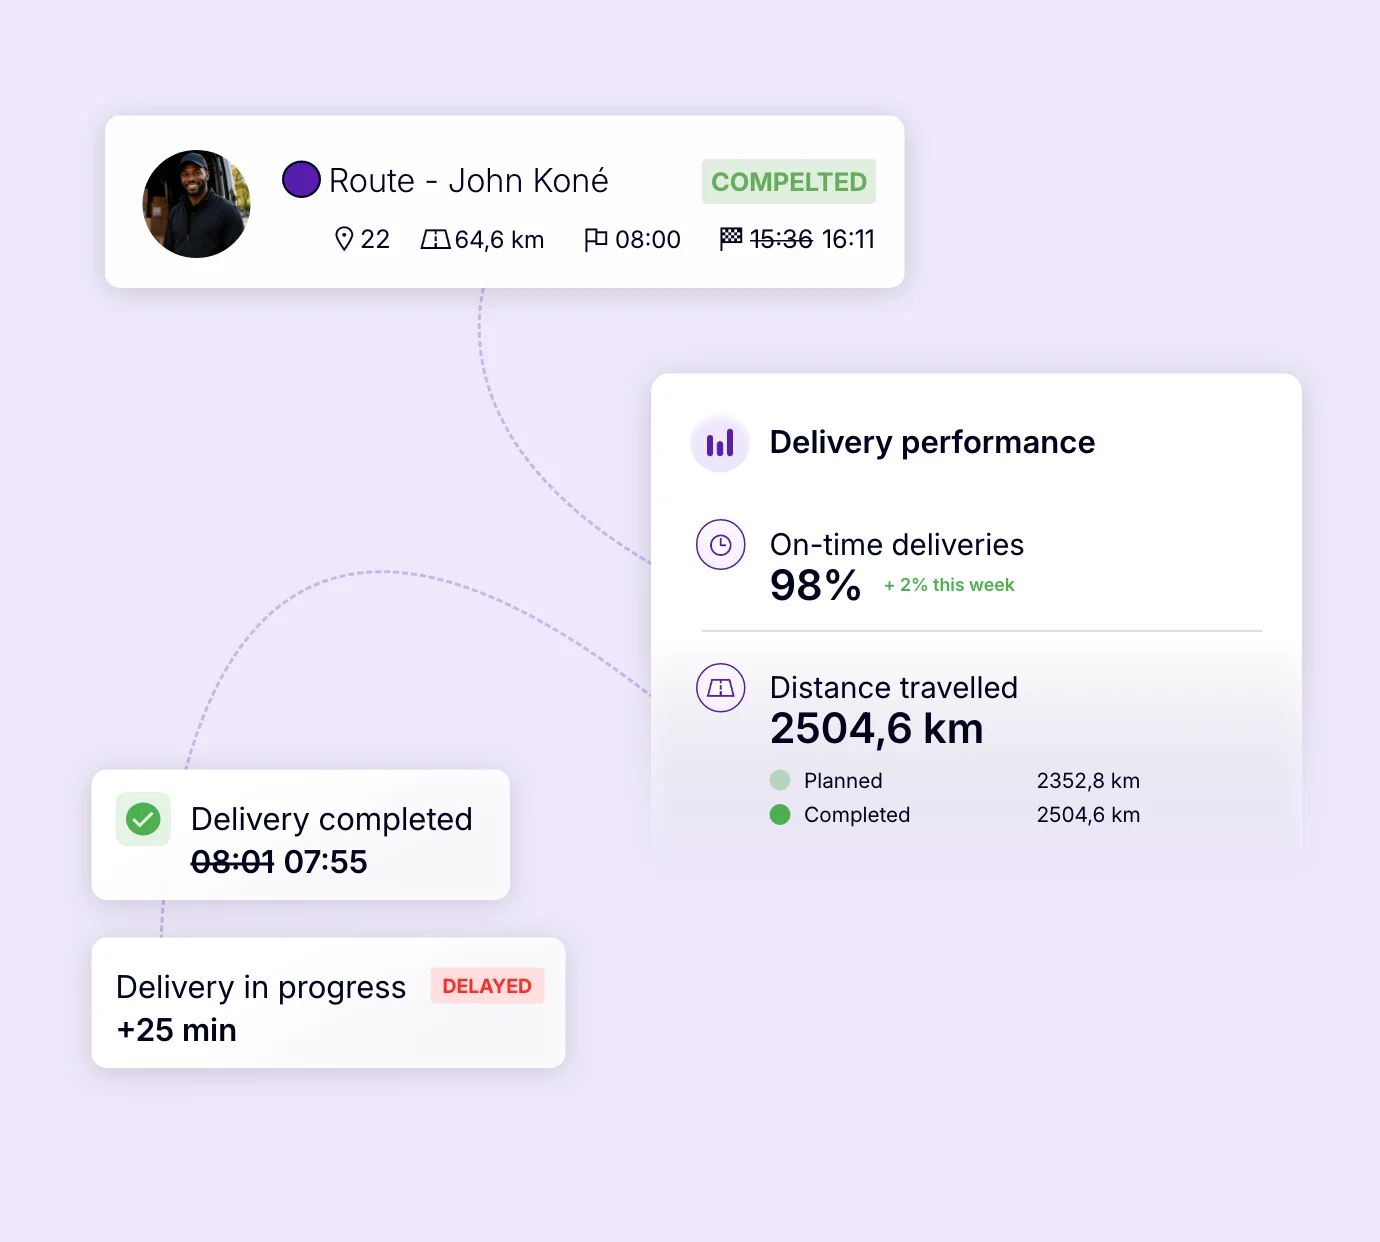
AntsRoute uses data collected throughout your routes: actual delivery times, stop statuses — delivered, rescheduled or cancelled — reasons for delays or failed deliveries, proof of delivery and distance travelled.
This gives you KPIs based on the actual execution of your routes, rather than simply what was planned.
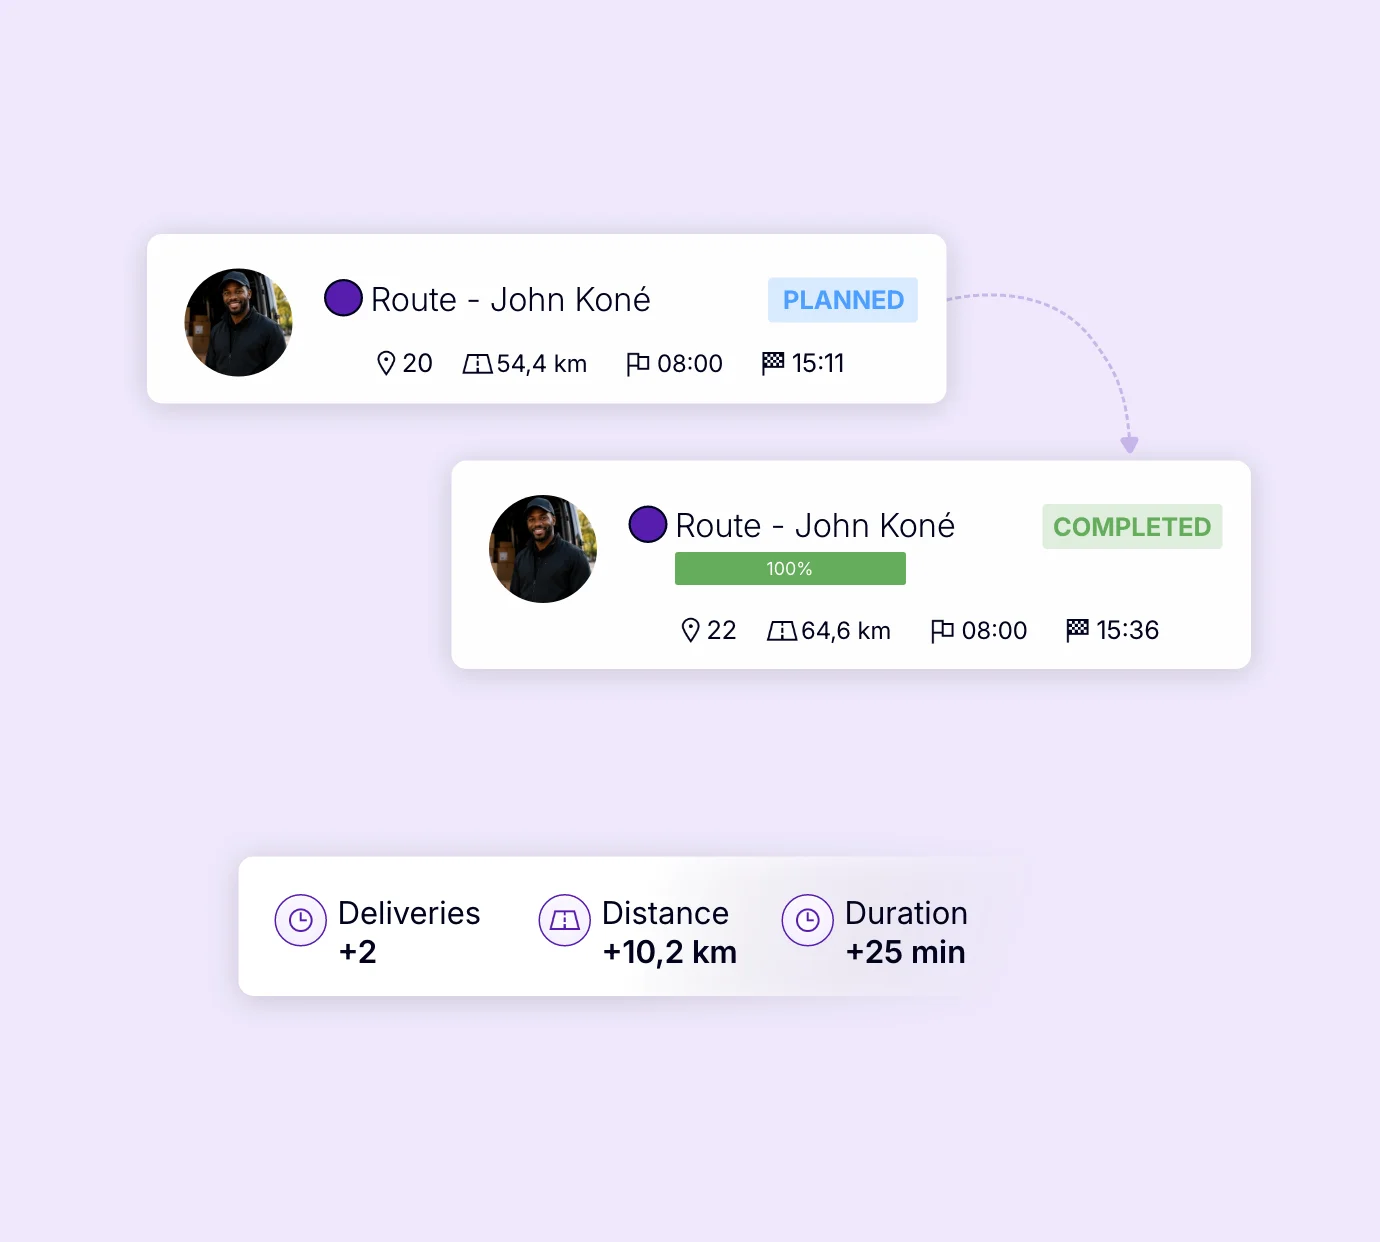
You can compare planned versus actual performance and better understand the gaps that affect your results.
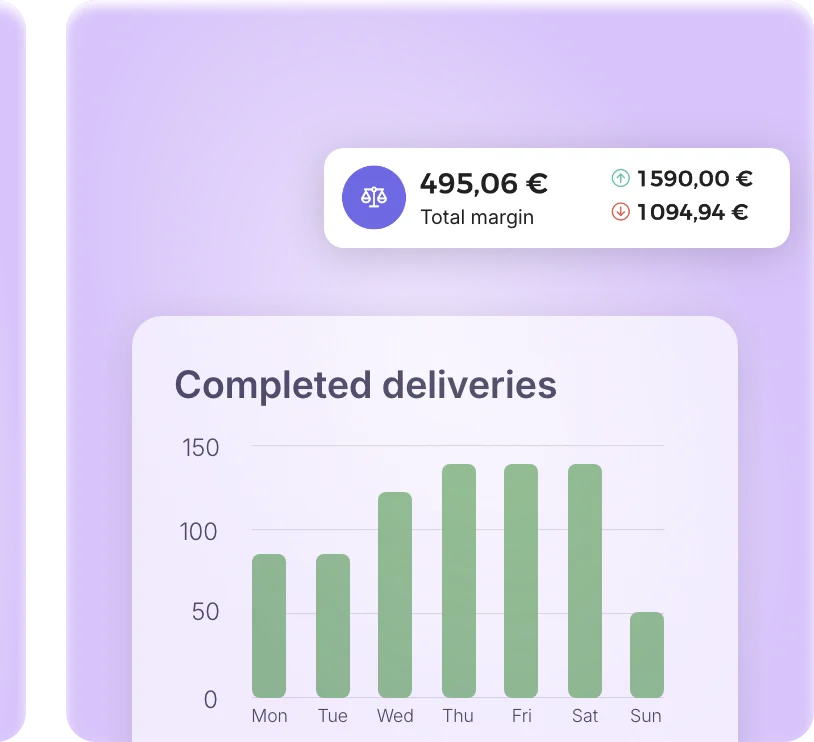
Delivery management
Analysis is a key pillar of delivery management
Managing deliveries also means analysing what happened to improve future routes. KPIs therefore complement route optimisation, driver tracking, unexpected issue management and proof of delivery.
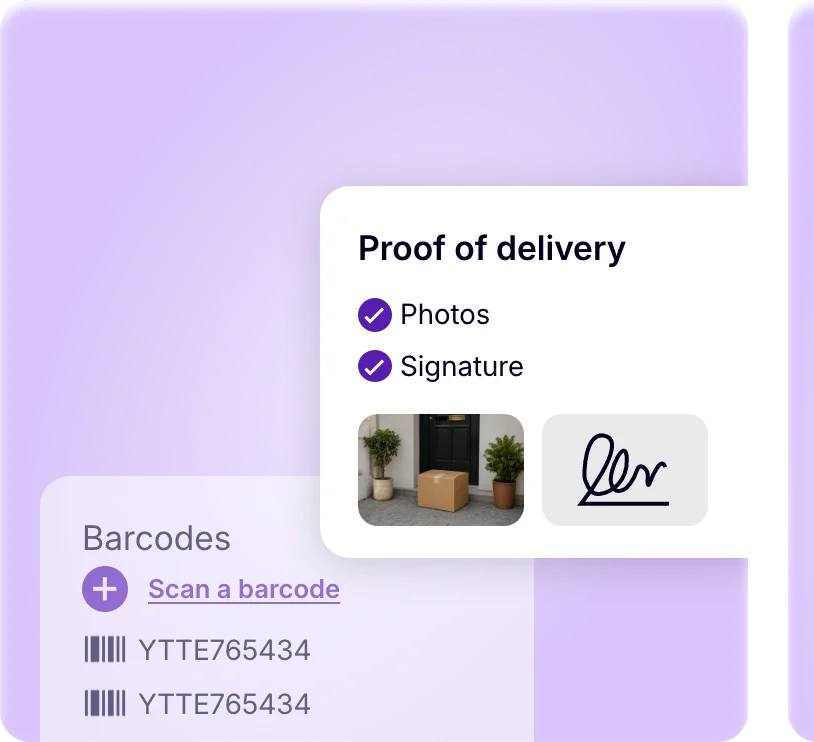
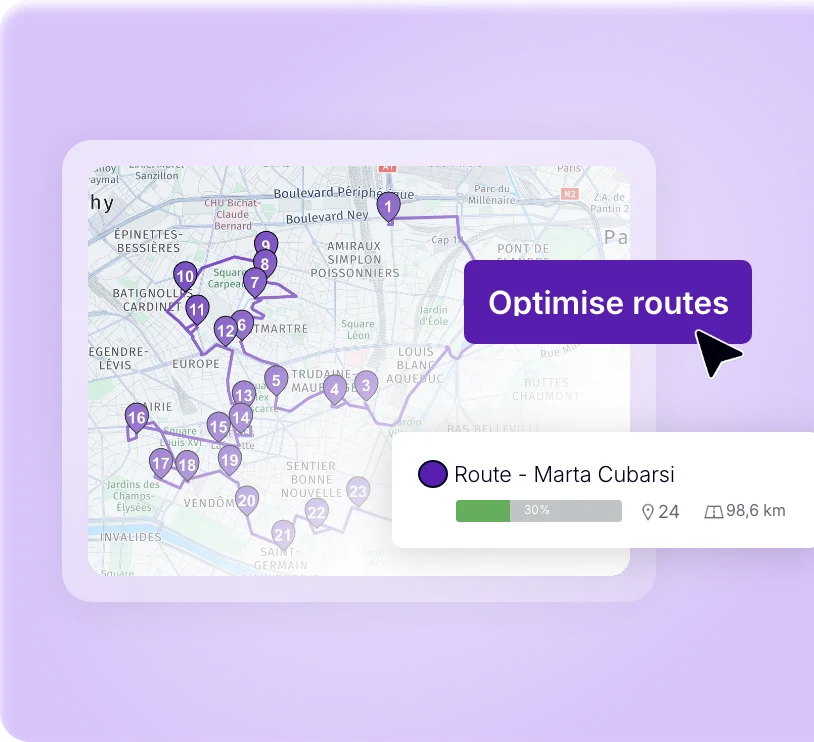
The KPIs that really matter for your deliveries
AntsRoute enables you to track the metrics that have a direct impact on your operations. The metrics are easy to understand and can be used directly by your teams. You don’t need to be a data expert to use them day to day.
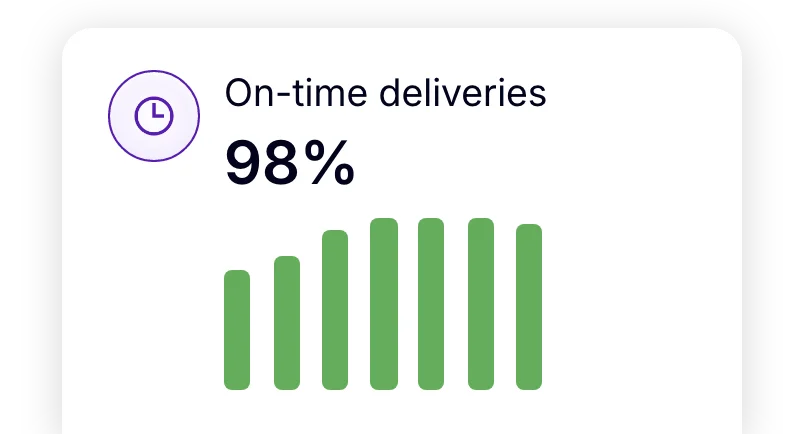
On-time performance and meeting time slots
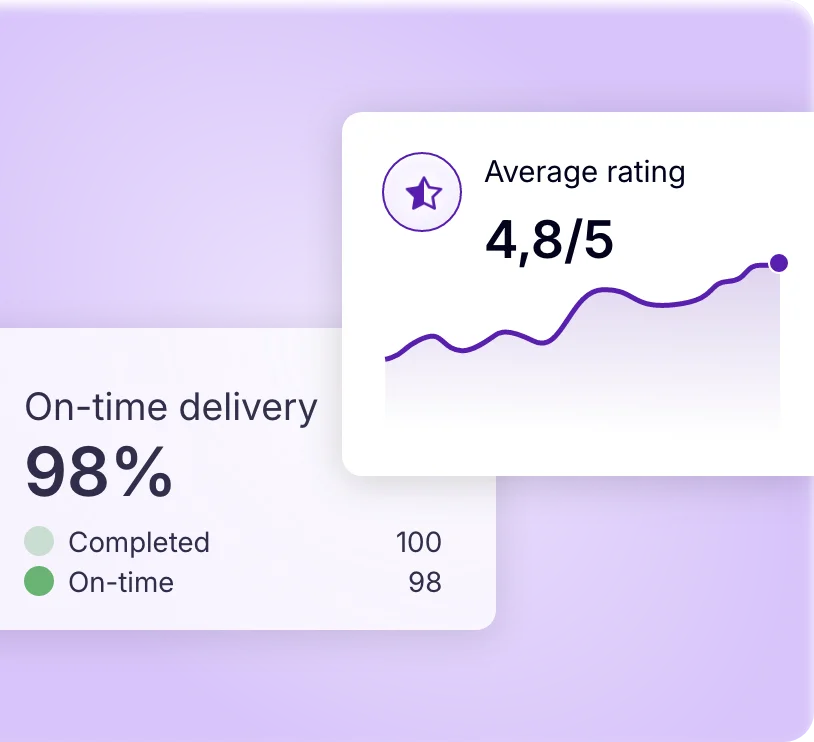
Measure your ability to meet the delivery times promised to your customers.
First-attempt delivery rate
Track the proportion of deliveries completed on the first attempt and identify situations that require a second delivery attempt.
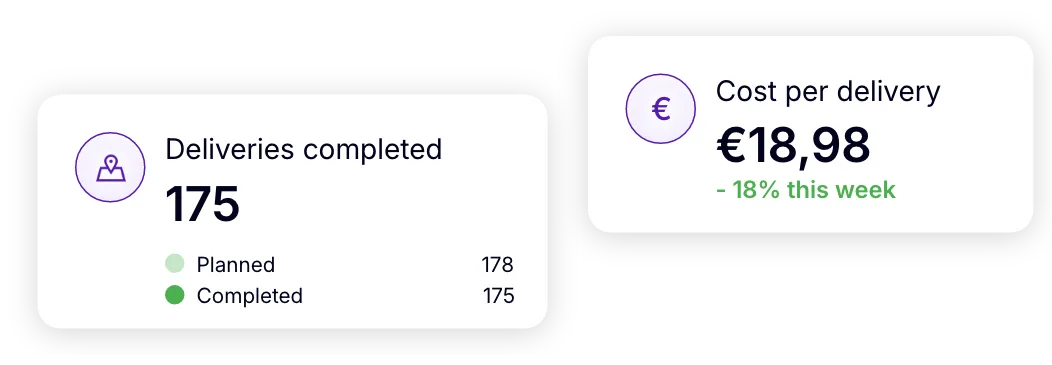
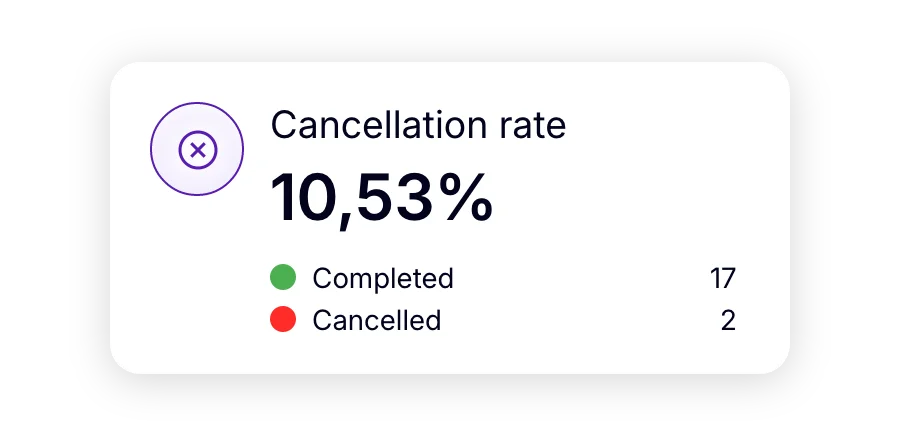
Delays, rescheduled and failed deliveries
Analyse their frequency and associated causes to identify recurring issues.
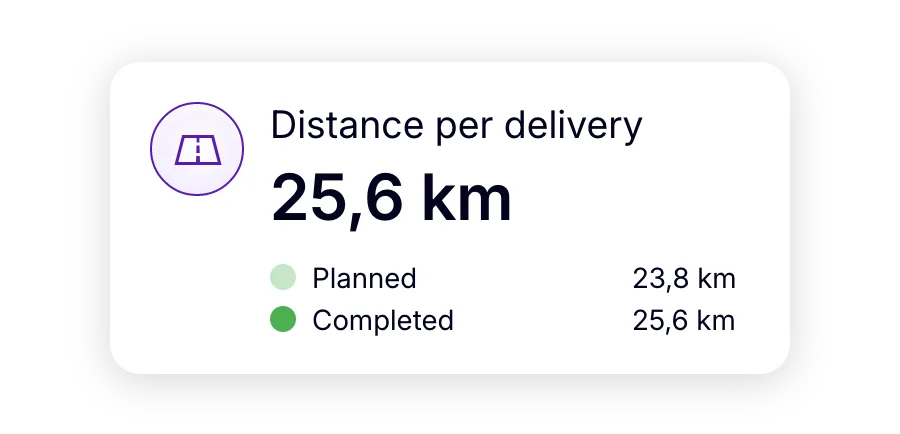
Actual route and delivery durations
Compare planned durations with the actual time spent in the field.
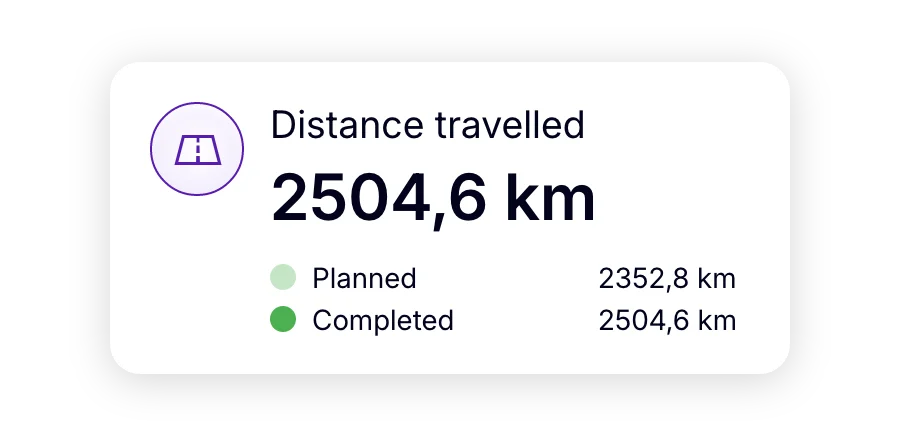
Distance travelled
Track the distances covered by your drivers and how they change over time.
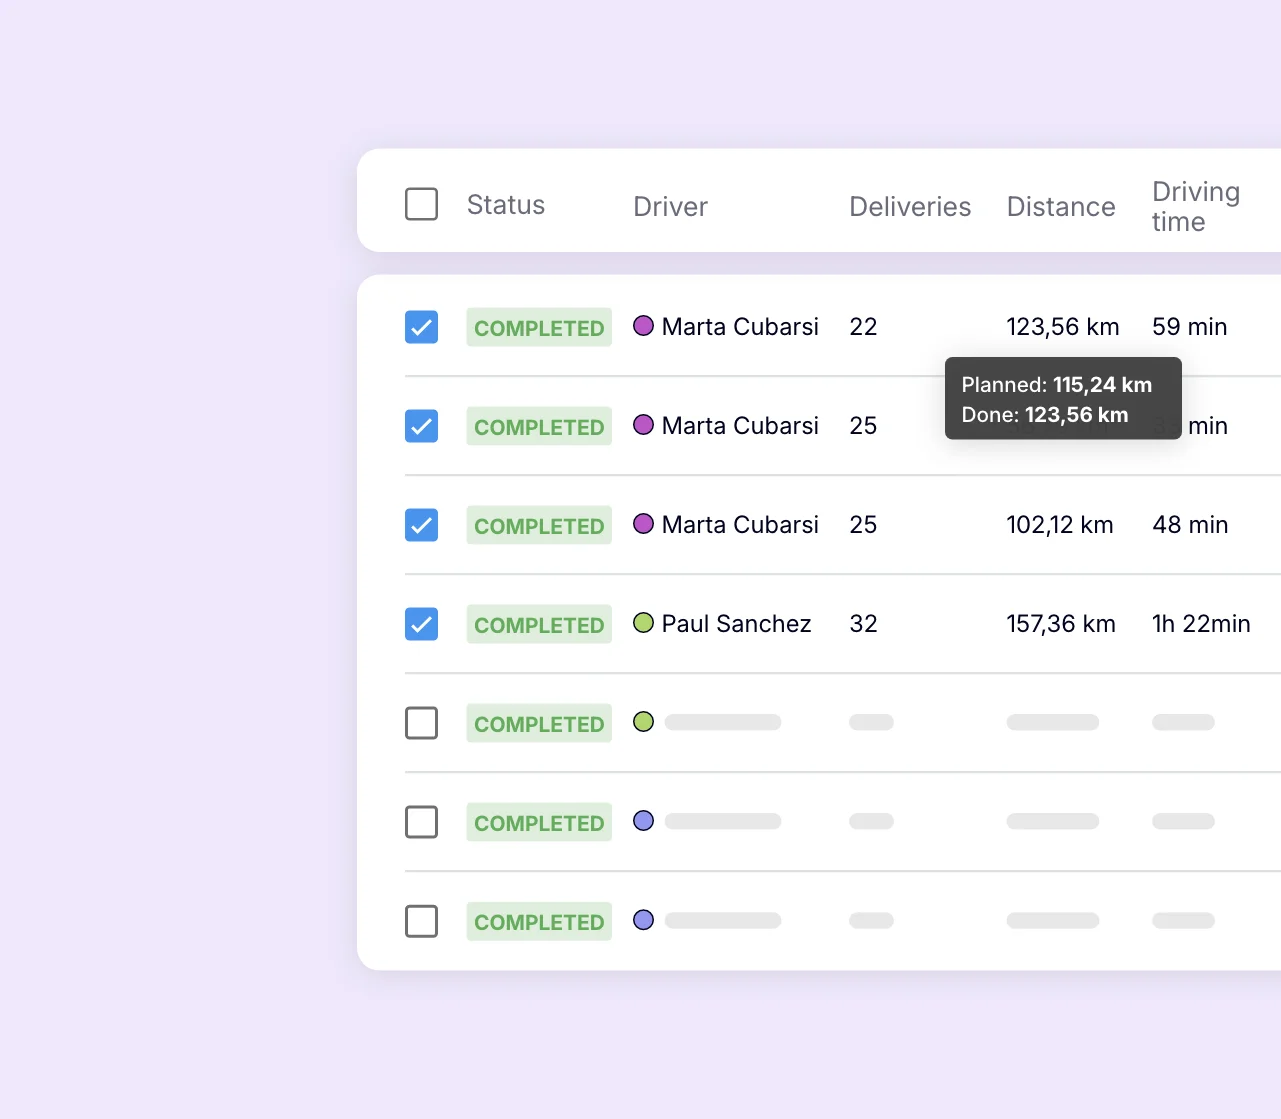
Understand the gaps to improve your routes
KPIs aren’t just about measuring results. They help you understand why your performance changes.
You can identify recurring causes of delays or rescheduled deliveries, compare different periods, routes or delivery areas, and measure the impact of changes to your operations.
You can then use these insights to refine your planning rules, adapt your constraints and progressively improve your routes.
Useful data for the whole organisation
Delivery KPIs aren’t just for those responsible for reporting. The whole organisation can work from the same data collected in the field.

For operations
Identify recurring issues, track how your routes evolve and gain concrete insights to adjust your operations.

For customer service
Rely on reliable information to answer questions about a delivery, delay or rescheduled delivery.

For management
Track performance over time and gain a consolidated view to inform your decision-making.
Long-term, visible benefits
Regularly analysing your KPIs helps make your operations more predictable and focus your efforts on the areas that genuinely need improvement.
You can:
- better track the on-time performance of your deliveries;
- identify the causes of missed or rescheduled deliveries;
- monitor changes in distance travelled;
- measure the impact of changes to your operations;
- track your performance from one period to the next.
Data doesn’t make day-to-day operations more complicated. It makes them easier to understand and improve.
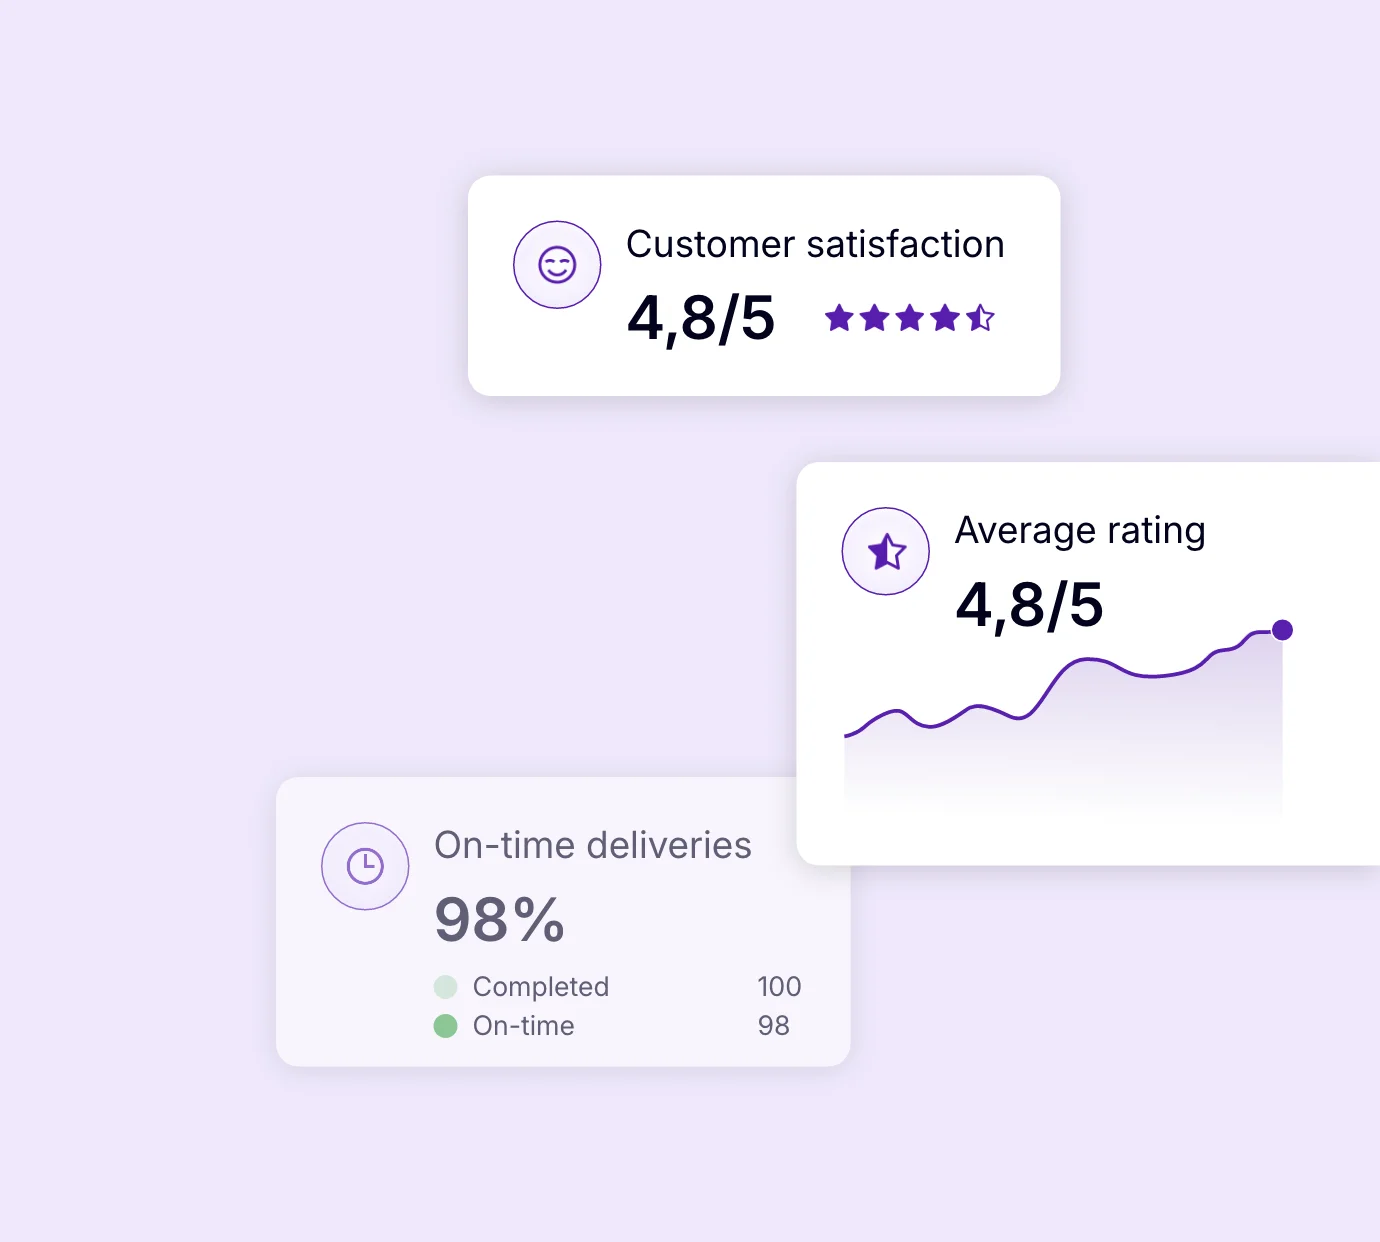
When delivery analysis becomes essential
KPI analysis becomes particularly valuable when your operations become harder to assess based on simple impressions.
It becomes especially useful when you need to:
- understand why certain delays keep recurring;
- improve your first-attempt delivery rate;
- accurately track compliance with customer time slots;
- compare performance across different periods or delivery areas;
- monitor changes in distance travelled;
- measure the impact of a new operating model;
- maintain a clear overview as your delivery volumes increase.
Frequently asked questions about delivery analysis and KPIs
Yes. The KPIs are based on data collected during the routes: arrival times, delivery statuses, distance travelled and information associated with each stop. This allows you to analyse what actually happened in the field.
Yes. You can track changes in your KPIs over different periods to identify trends, compare performance and measure the impact of adjustments to your operations.
Operational KPIs, such as on-time performance or first-attempt delivery rate, measure the quality of delivery execution. Financial KPIs, such as the cost of a route, assess economic performance. Analysing them together helps put operational efficiency and costs into perspective.
By analysing recurring gaps — delays in certain areas, regularly missed time slots or changes in distance travelled — you can identify areas for improvement. You can then use these insights to adjust your planning rules and optimise your future routes.
Yes. The KPIs are designed to be easy to understand and directly actionable for operational teams. You can quickly identify the information you need without having to build complex reports.
What if your data became a real driver for improvement?
Analysis is most valuable when it helps you deliver better, day after day.
7-day free trial. No commitment.