
Donnez du sens à vos tournées du dernier kilomètre
Boostez votre productivité, facilitez le quotidien des équipes terrain et offrez une expérience 5 étoiles à vos clients grâce à la plateforme SaaS de gestion et d’optimisation de tournées AntsRoute.
- Optimisez vos tournées en quelques secondes
- Suivez vos équipes terrain en direct
- Interagissez avec vos clients
ADOPTÉ PAR +3000 PROFESSIONNELS ITINÉRANTS DANS LE MONDE
![]()
![]()

![]()
![]()
Livraison
Boostez votre productivité et facilitez le quotidien de vos chauffeurs-livreurs avec notre plateforme SaaS de gestion des livraisons innovante.
Intervention
Boostez votre activité et simplifiez le quotidien de vos techniciens de terrain avec notre logiciel de gestion d’interventions simple et automatisé.
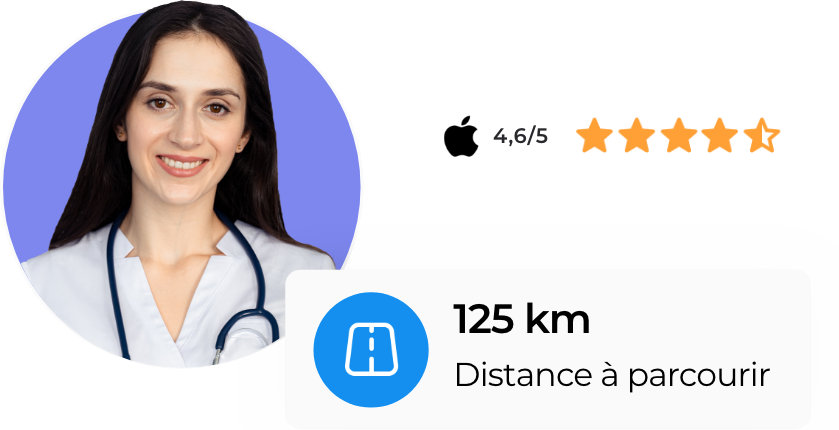
Santé à domicile
Facilitez l’organisation de votre activité et le quotidien des soignants itinérants avec notre logiciel SaaS de gestion des soins à domicile.

Fidélisation des clients
Offrez une expérience sans fausse note en respectant les délais annoncés et assurant une communication optimale.

Durabilité du dernier km
Réduisez les émissions carbones de votre flotte de véhicules en limitant les trajets inutiles ou à vide.

Satisfaction des équipes
Améliorez les conditions de travail de vos équipes terrain ou livreurs grâce à des tournées réalistes et équilibrées.

Profitabilité de l’activité
Augmentez la productivité de vos équipes en réduisant les temps de conduite de 20% entre deux étapes.
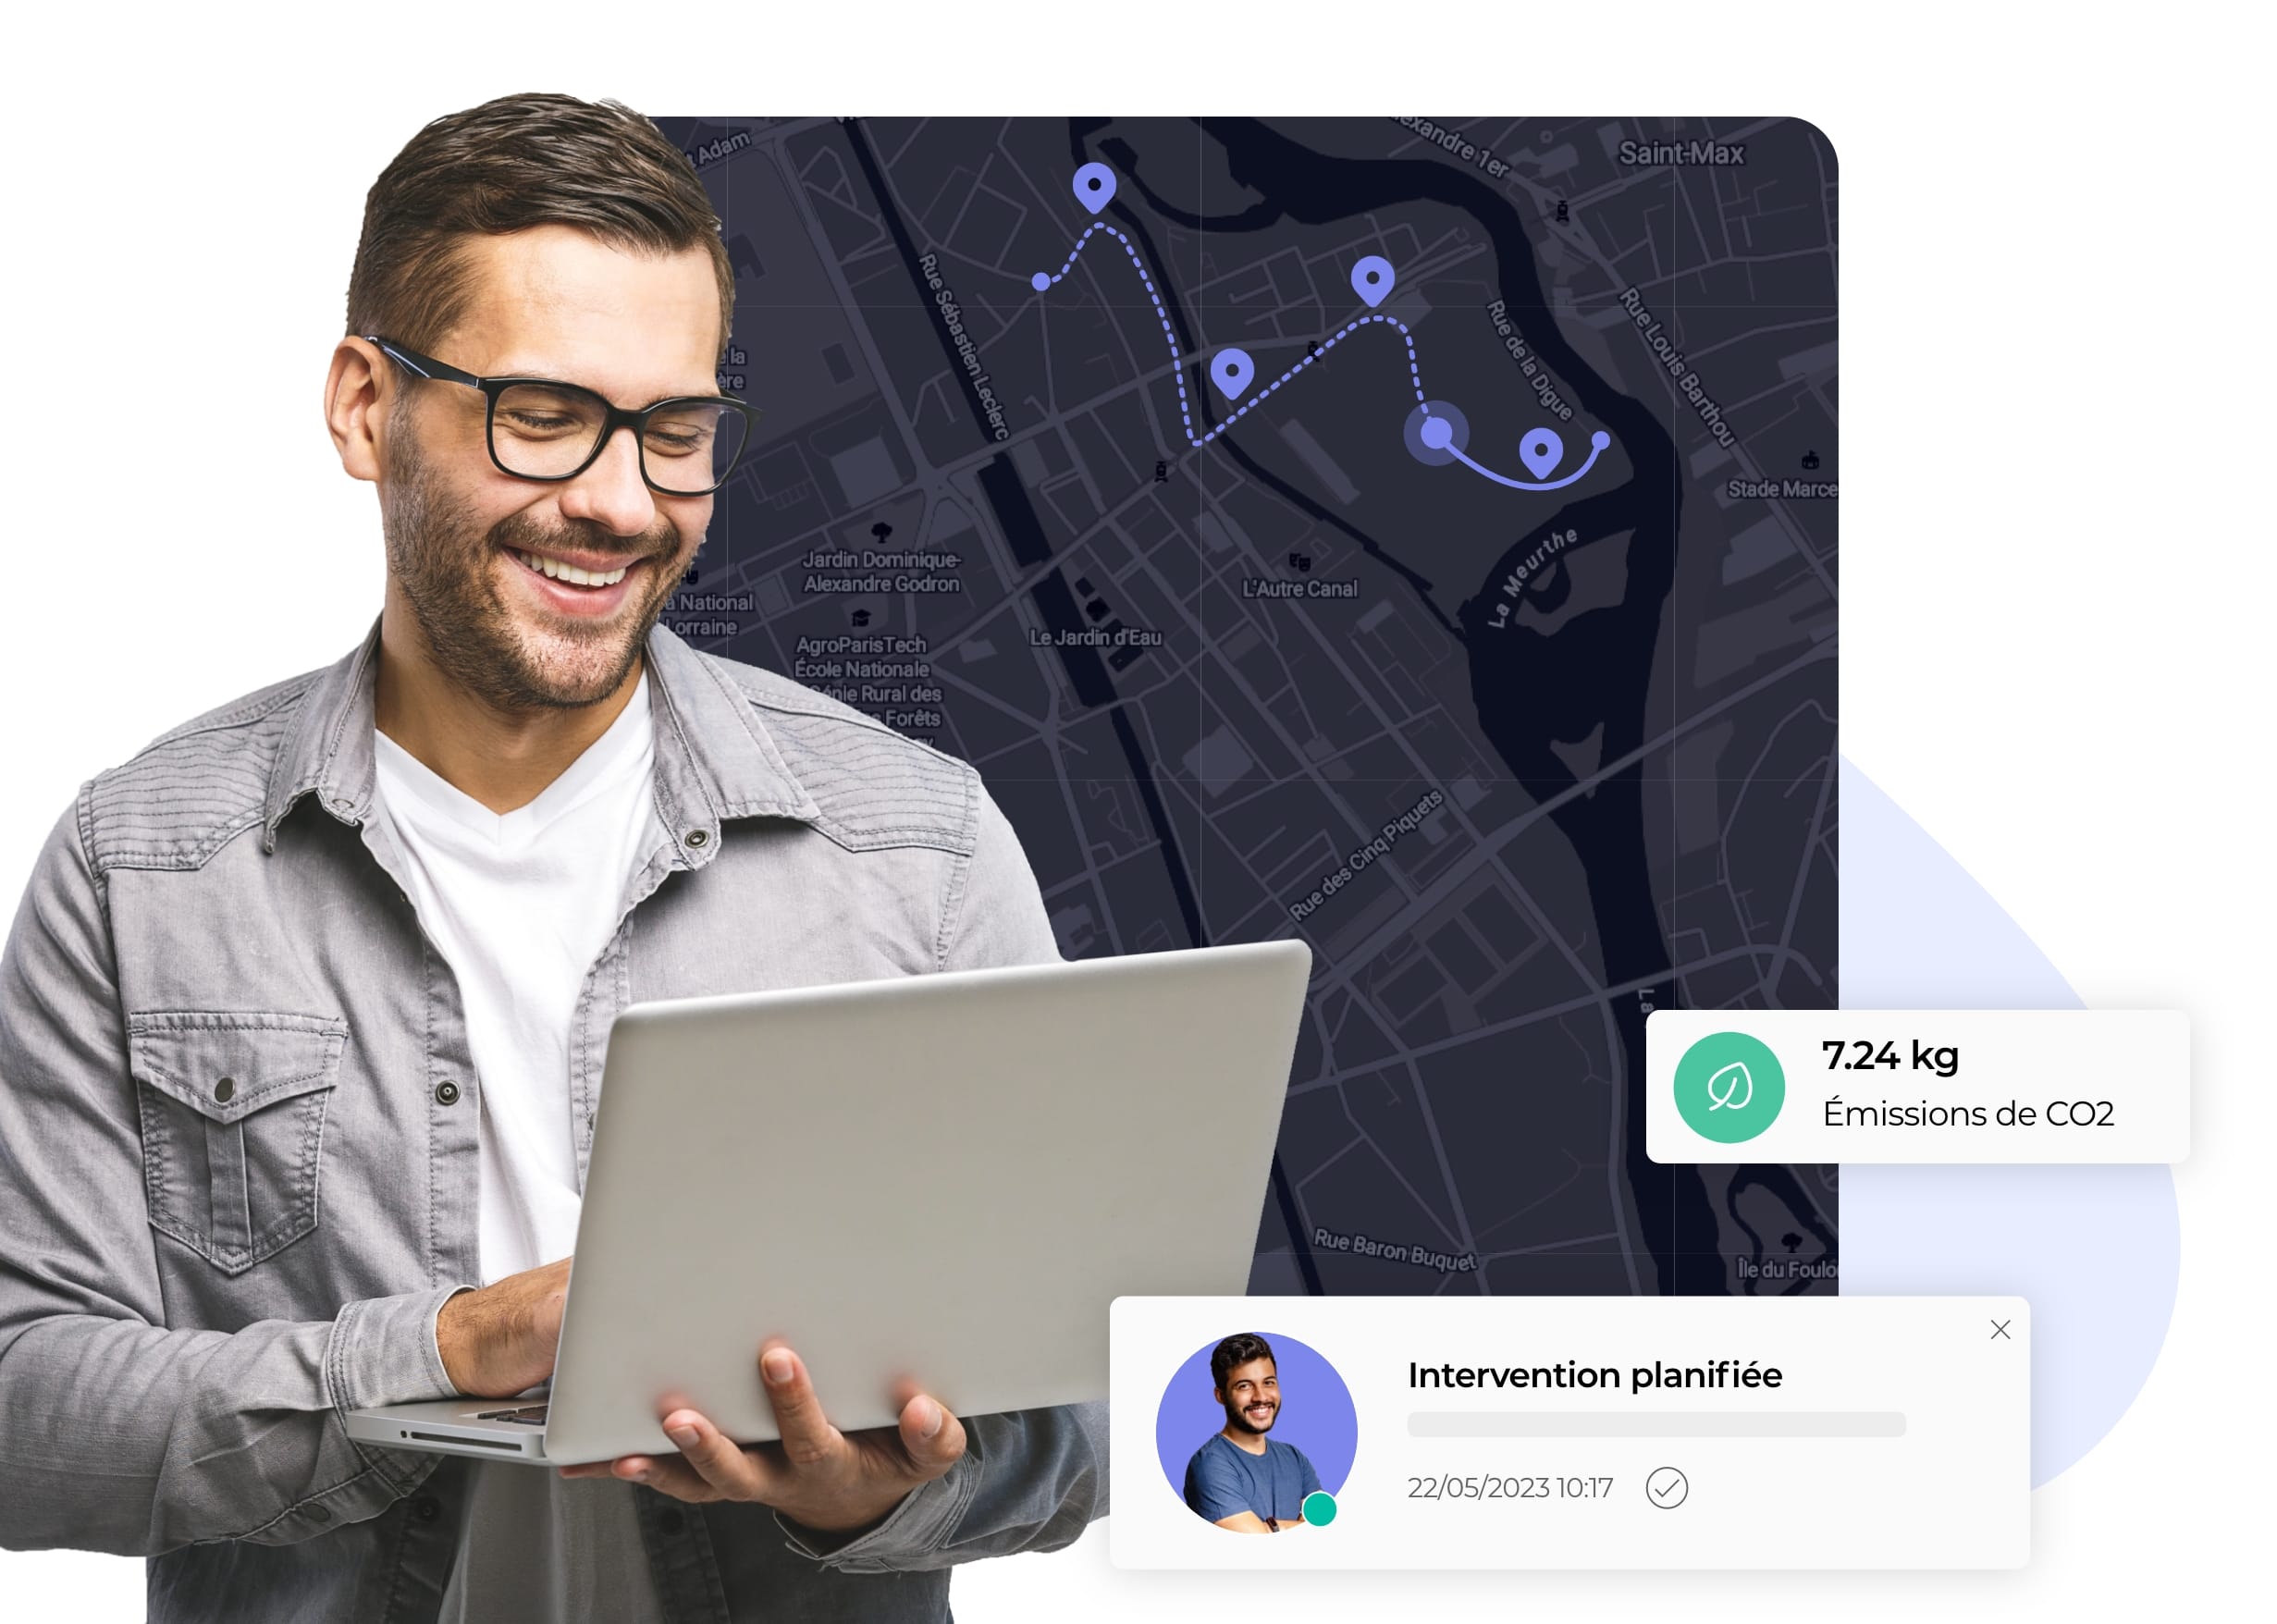
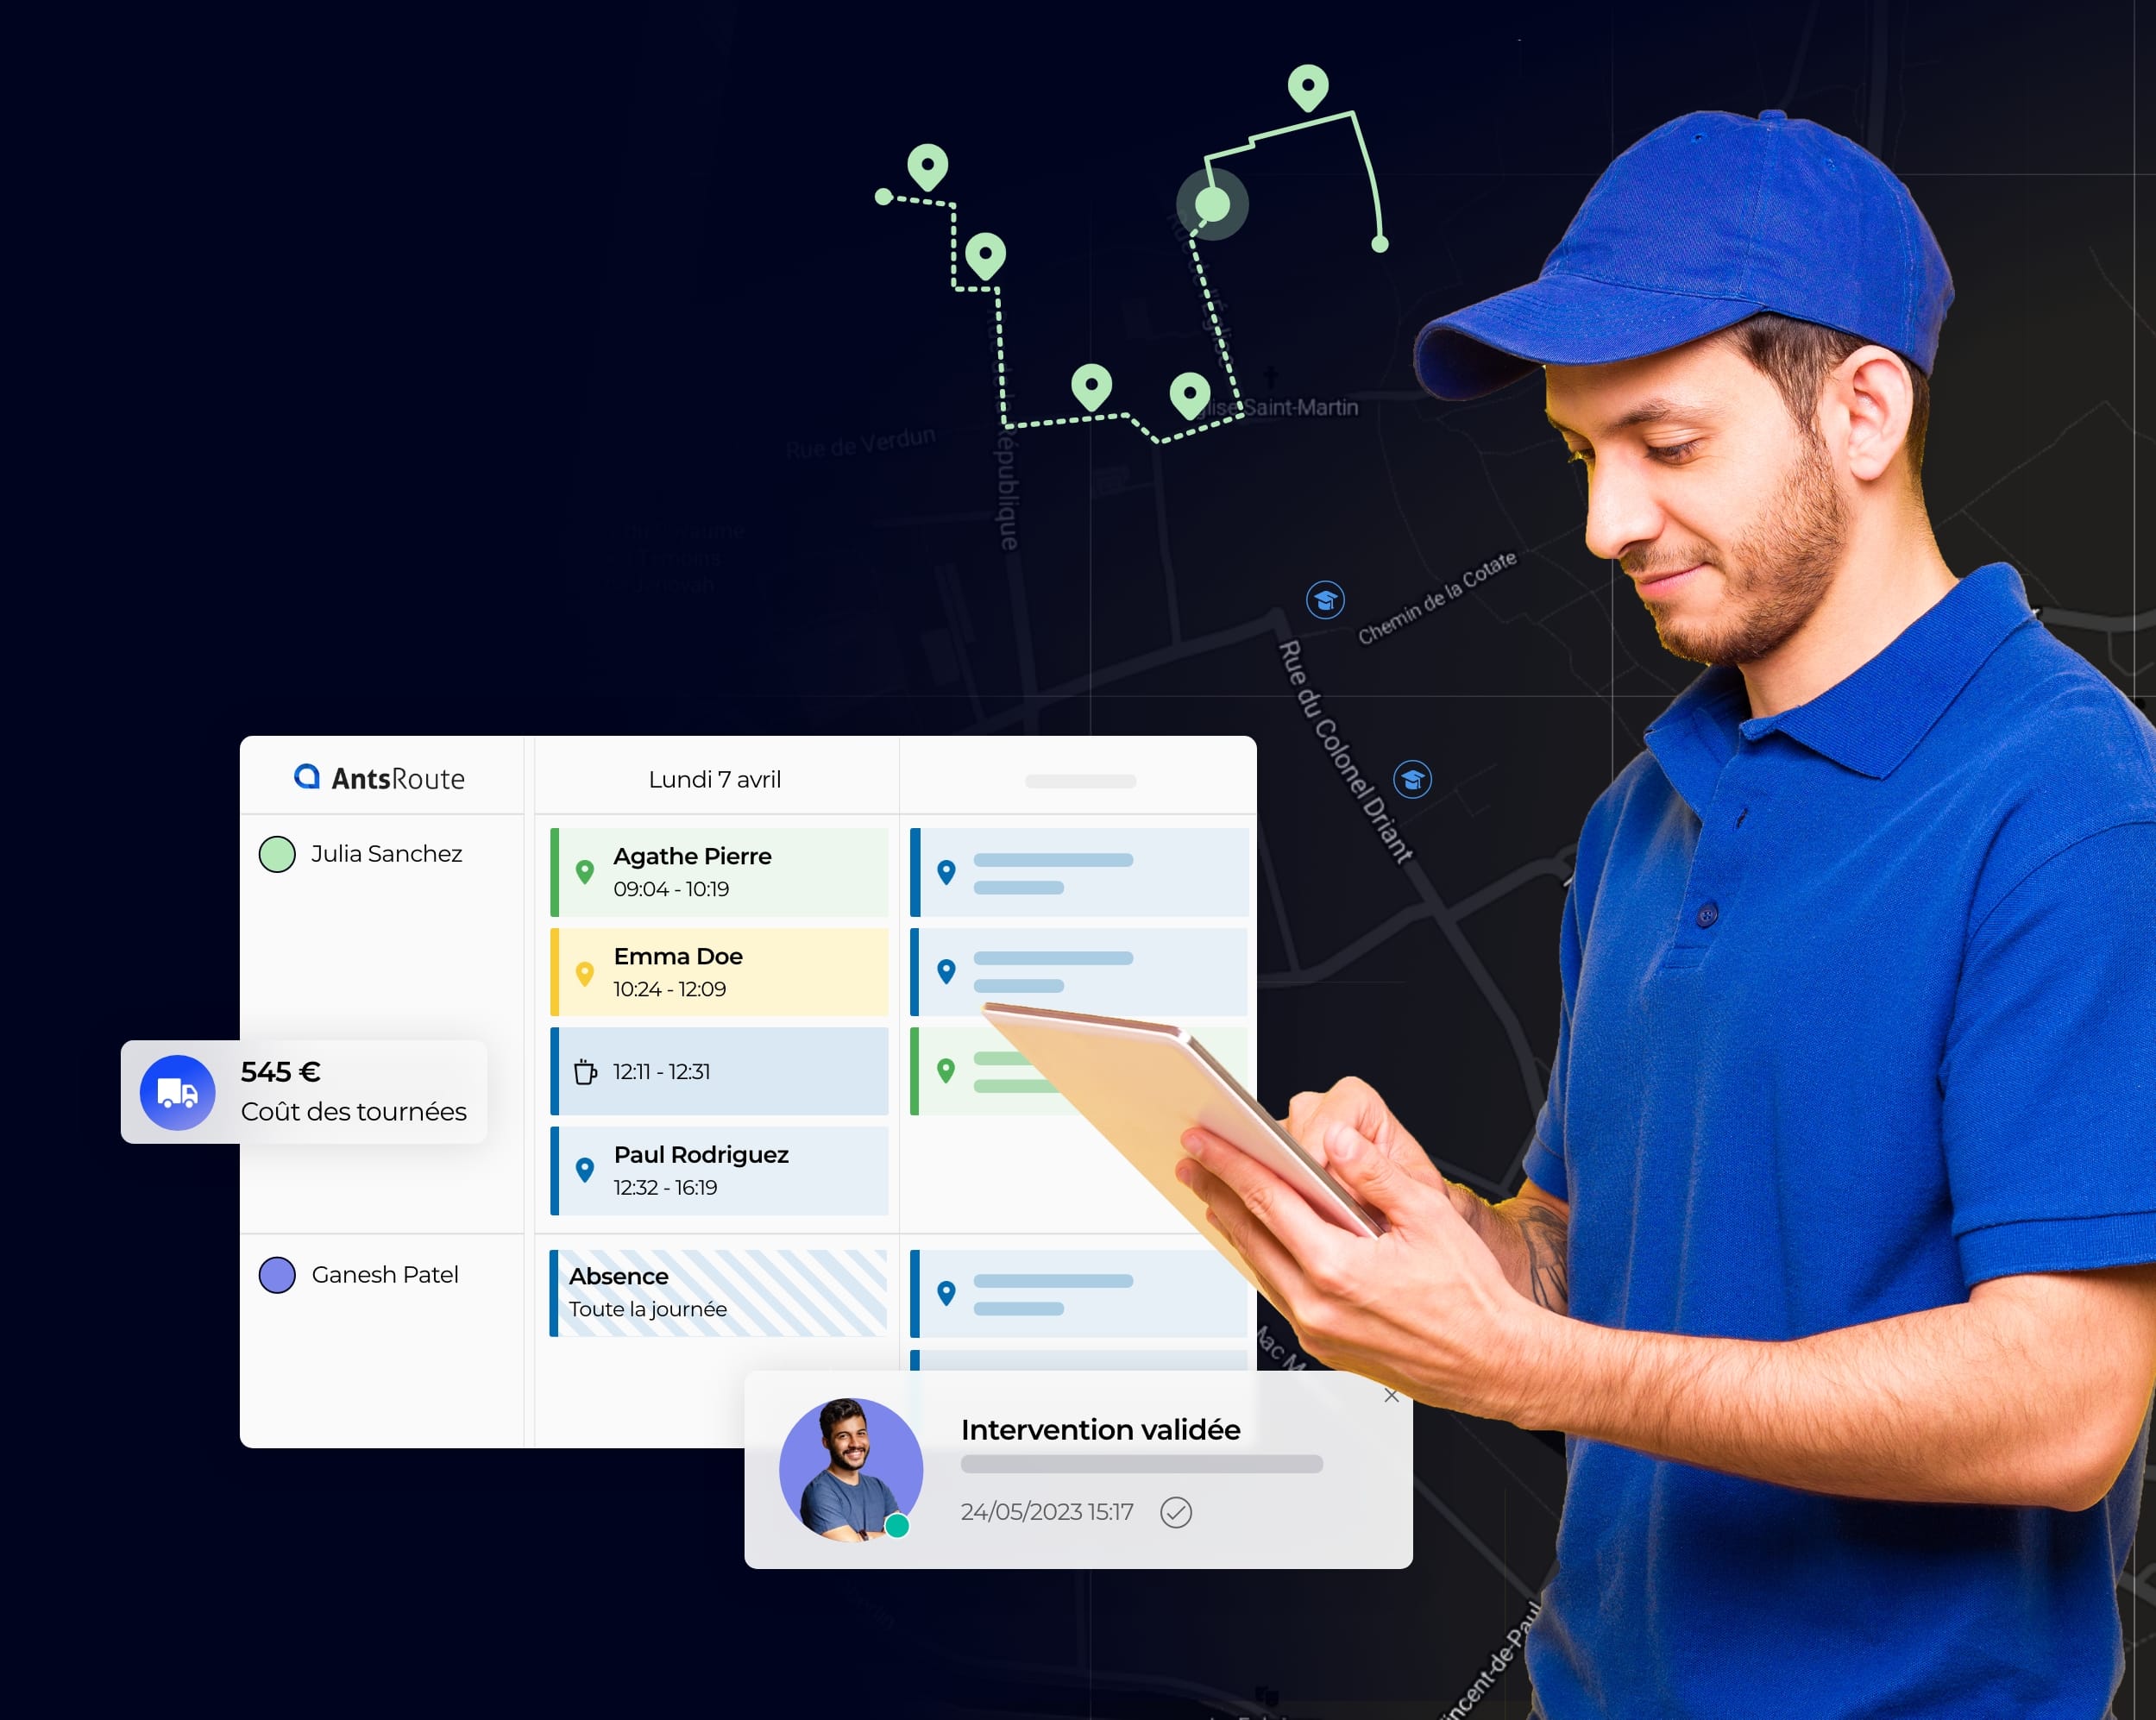
Organisez vos tournées en toute simplicité
Mettez à disposition de votre responsable d’exploitation ou dispatcheur une interface unique pour organiser de façon optimale les itinéraires de vos équipes terrain.
- Planification des étapes
- Optimisation des tournées
- Suivi de l’exécution en direct
- Analyse des performances
- Planification des étapes
- Optimisation des tournées
- Suivi de l’exécution en direct
- Analyse des performances
3000+
Tournées quotidiennes
300+
Entreprises clientes
5+
Langues disponibles
10+
Pays où sont nos clients
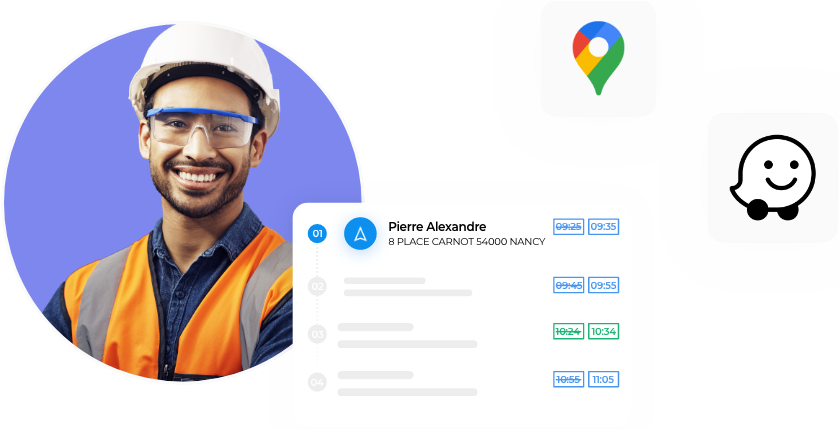
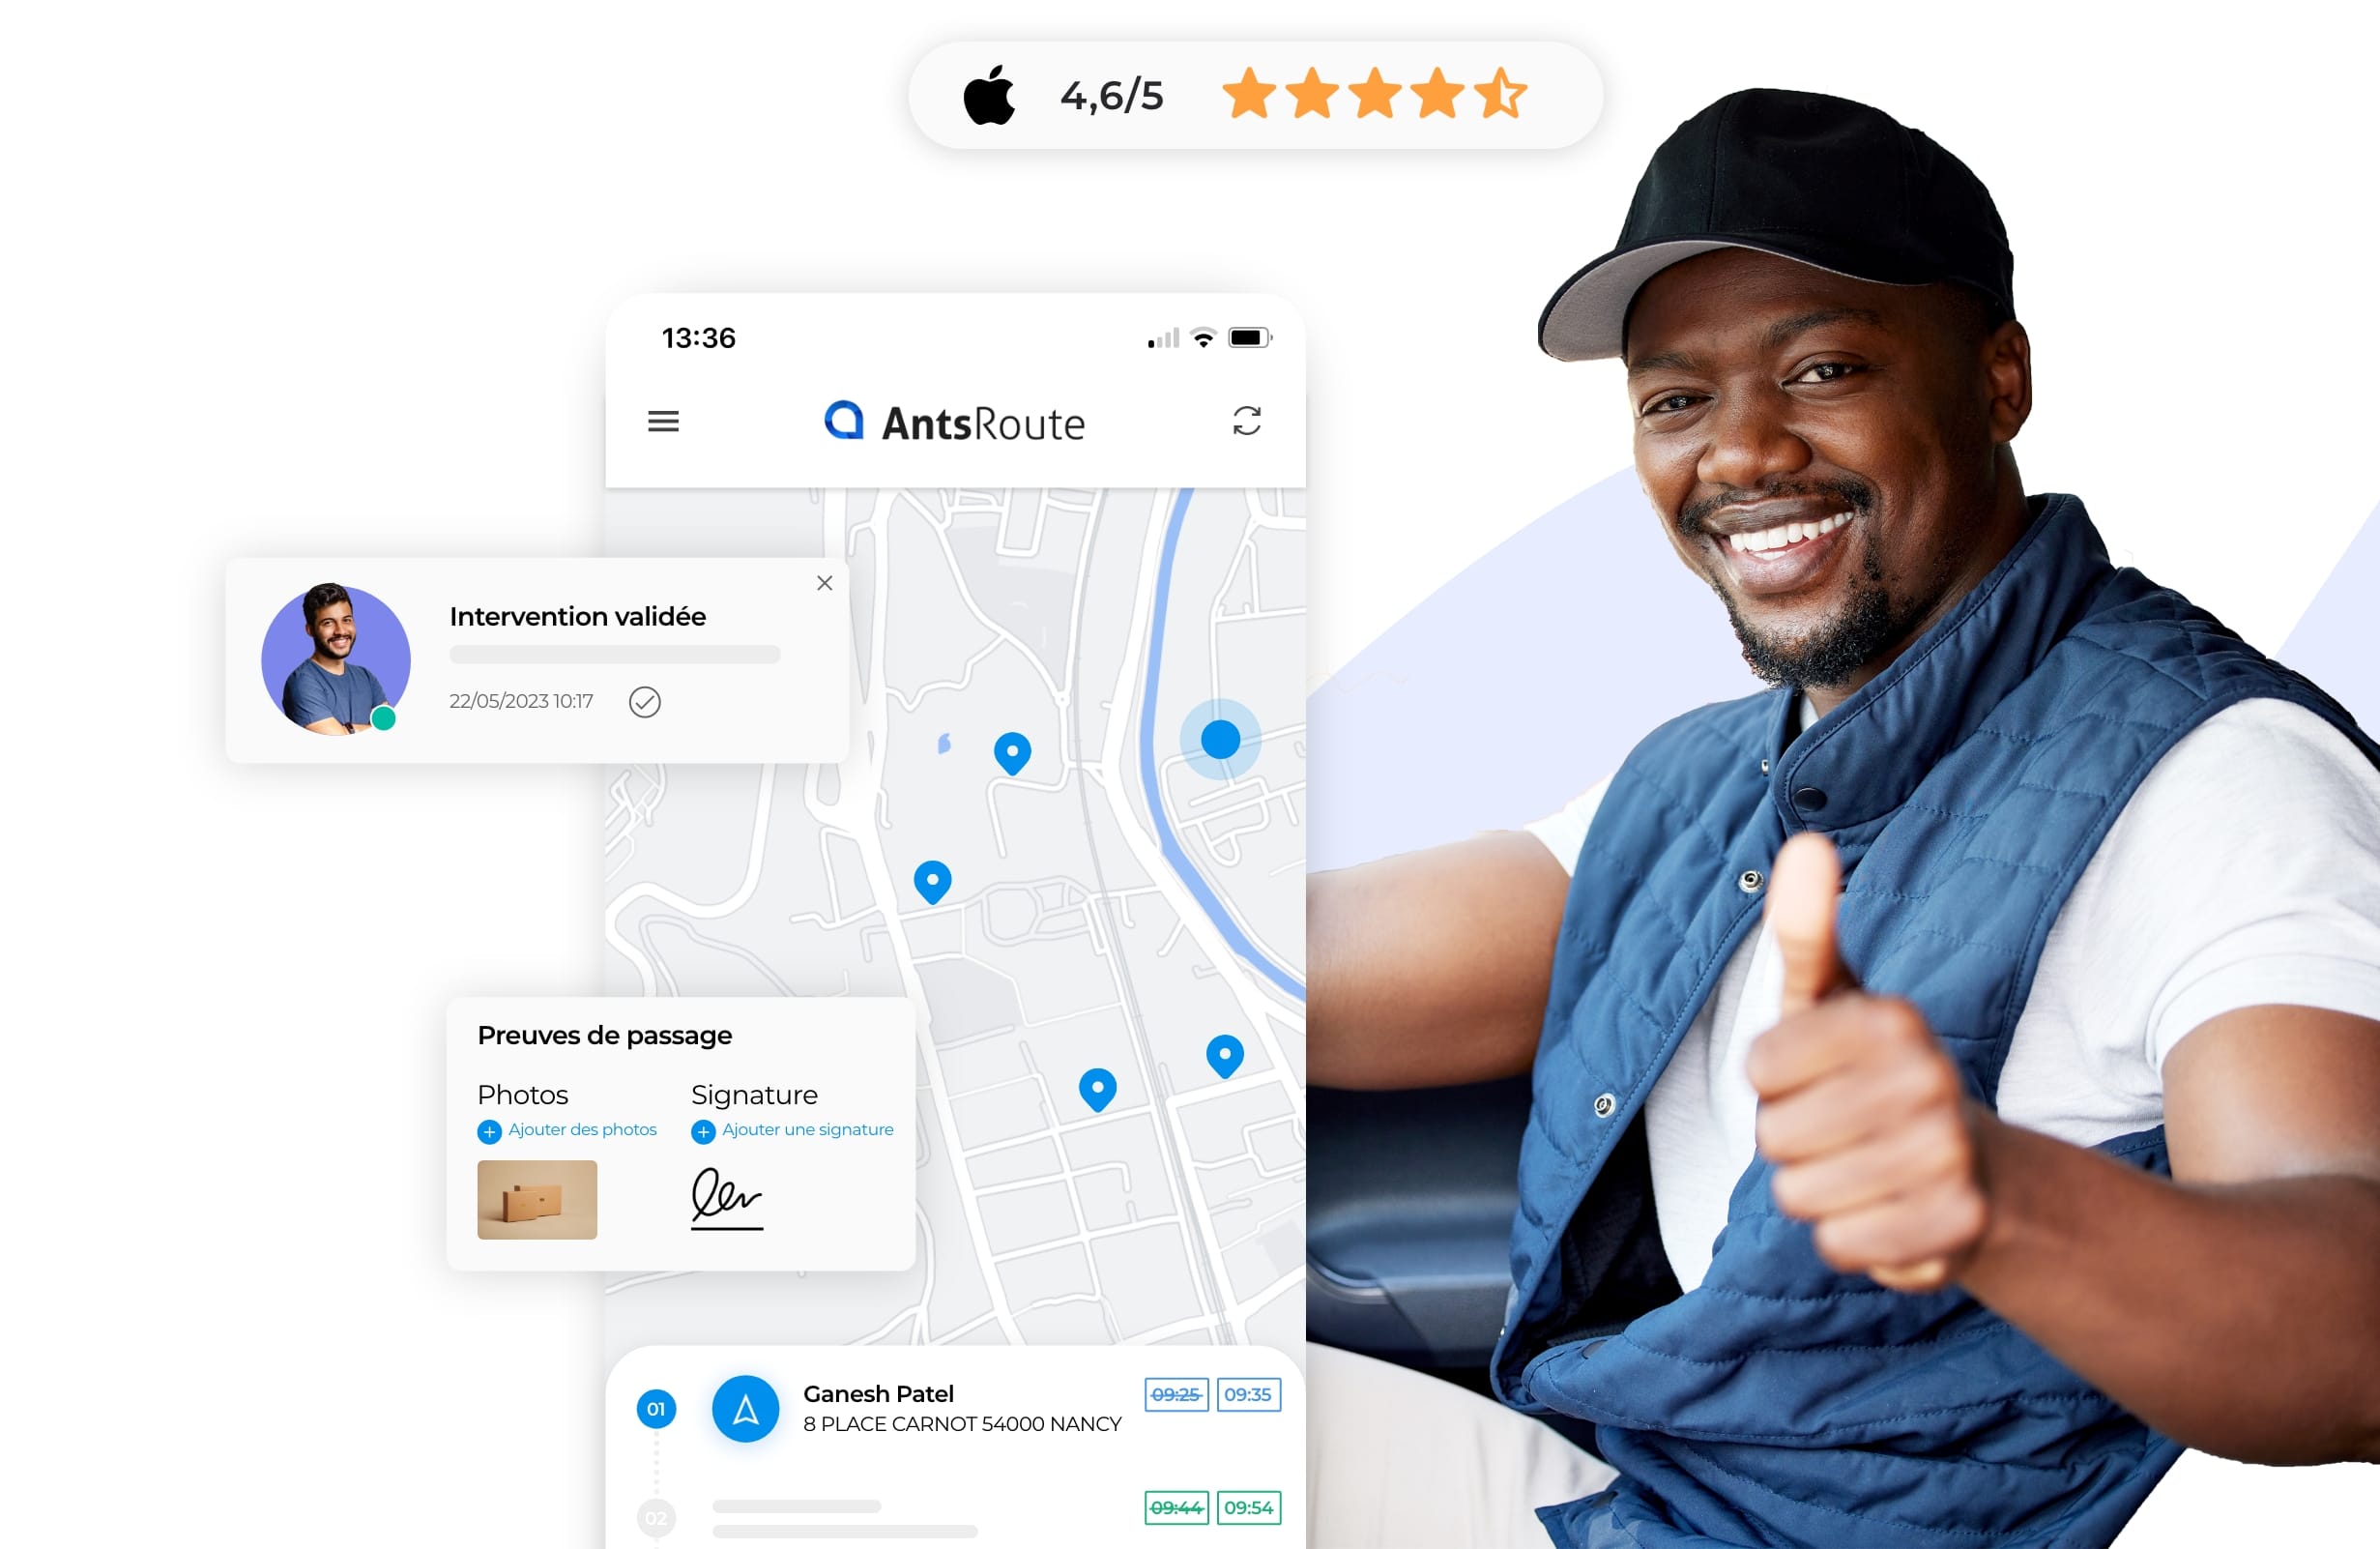
Accompagnez vos équipes terrain
Facilitez le quotidien de vos équipes mobiles avec des feuilles de route dématérialisées accessibles depuis l’application mobile AntsRoute, disponible sur iOS et Android. Grâce à l’application, disposant d’un accès en mode offline, vous renforcez l’autonomie de vos salariés et vous gardez une maîtrise complète de votre activité sur le terrain.
- Feuilles de route dématérialisées
- Navigation Waze ou Google Maps
- Géolocalisation des équipes
- Calcul de la durée réelle sur site
- Preuves de passage
- Planification depuis l’application
- Feuilles de route dématérialisées
- Navigation Waze ou Google Maps
- Géolocalisation des équipes
- Calcul de la durée réelle sur site
- Transmission des preuves de passage
- Planification depuis l’application
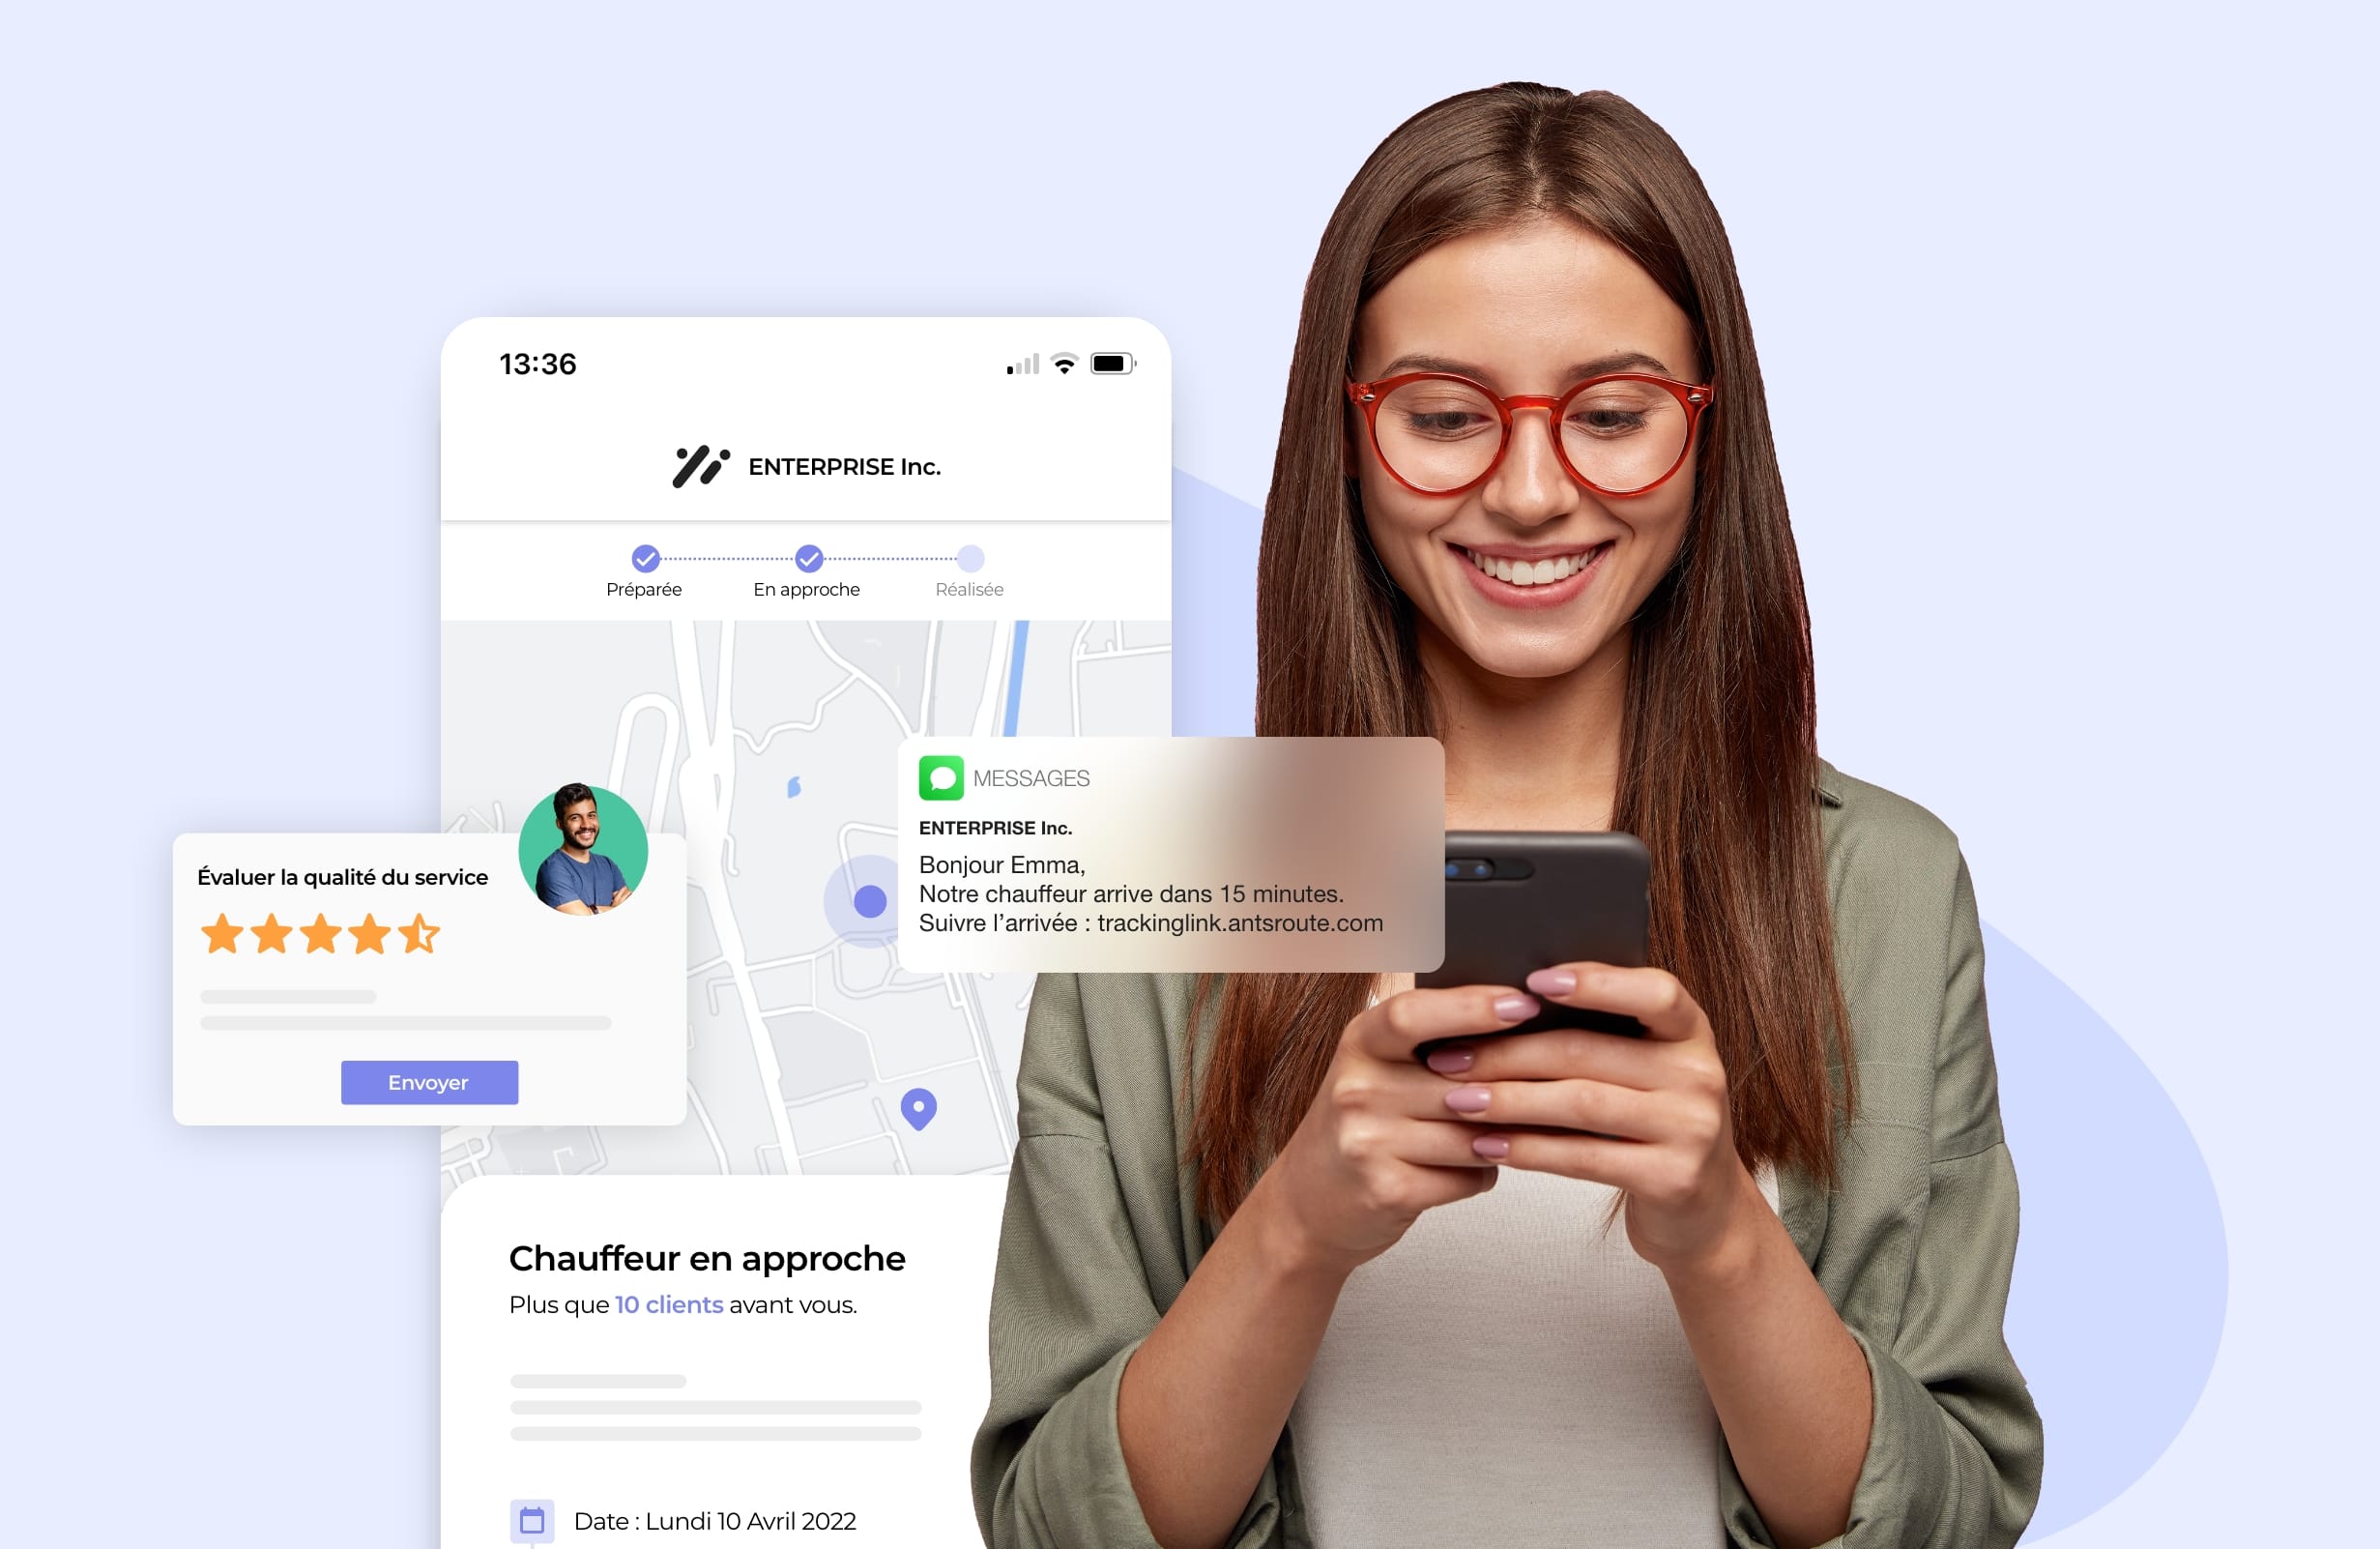
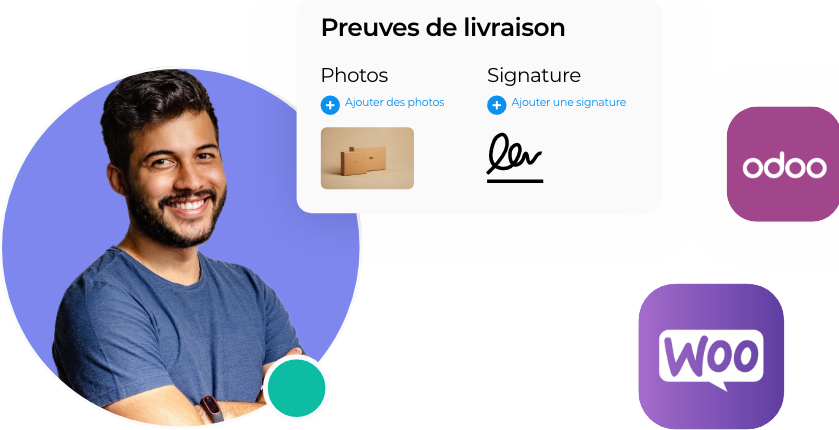
Proposez une expérience 5 étoiles à vos clients
Fidélisez vos clients en leur proposant une expérience optimale. Vous assurez un meilleur respect des délais de passage annoncés et transmettez en temps réel et à chaque étape des informations permettant aux clients de s’organiser.
- Notifications par SMS ou par email
- Site de prise de rendez-vous 24/7
- Reprogrammation en cas d’absence
- Tracking des commandes
- Envoi des comptes-rendus
- Évaluation des services
- Notifications par SMS ou par email
- Site de prise de rendez-vous 24/7
- Reprogrammation en cas d’absence
- Geotracking des commandes
- Transmission des comptes-rendus
- Évaluation des services
Intégrez vos applications favorites
Si vous disposez déjà d’un CRM ou d’un ERP pour gérer vos commandes, votre clientèle ou votre facturation, utilisez notre API pour connecter ces systèmes à votre compte AntsRoute. Bénéficiez également de nos intégrations avec de nombreuses applications.
Nos clients trouvent que le déploiement de AntsRoute est très simple
L’algorithme pense à des solutions que je n’aurais pas forcément imaginées, et qui tiennent très bien compte des contraintes fixées par les clients. Le cerveau humain a tendance à se dire qu’il trouvera la meilleure solution, mais c’est rarement le cas. L’algorithme a bien plus raison que l’humain !
Sébastien Specht
Cofondateur de la Boissonnerie de Paris
Démarrez l’optimisation de vos tournées
Essai gratuit de 7 jours | Aucune carte de crédit requise